The Economics of a Slow Burn: Three Paths for the UK’s Loss—and a Warning Shot for the U.S.

David O’Neill is a Professor of AI/Policy at the Gordon School of Business, SIAI, based in Switzerland. His work explores the intersection of AI, quantitative finance, and policy-oriented educational design, with particular attention to executive-level and institutional learning frameworks.
In addition to his academic role, he oversees the operational and financial administration of SIAI’s education programs in Europe, contributing to governance, compliance, and the integration of AI methodologies into policy and investment-oriented curricula.
Input
Modified
UK GDP per head is 6–8% below its no-Brexit path
The slow-burn hit was masked by transition rules and the pandemic
Without lower frictions and restored mobility, the drag endures; the U.S. risks similar
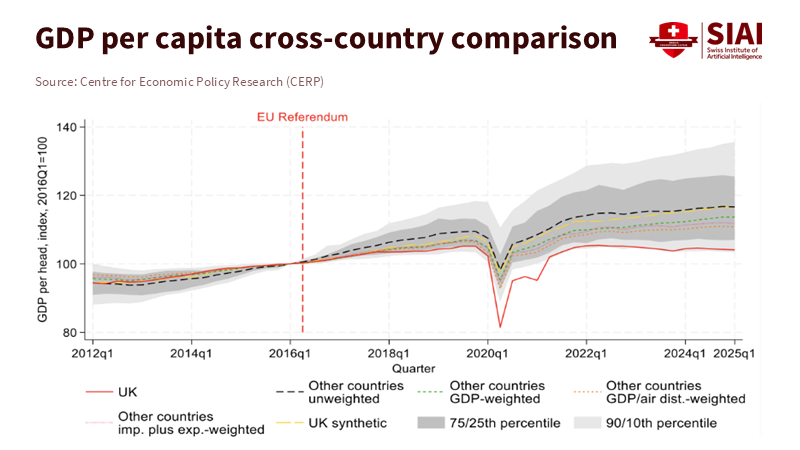
By 2025, UK GDP per person is expected to be 6-8% lower than it would have been if the UK had remained in the EU—a slow-burn loss reflected in reduced output, investment, and productivity. Independent modeling and official forecasts show persistent weakness in trade and productivity, which explains lagging living standards, underwhelming business investment, and a sluggish trade recovery relative to the G7. This is a story of numbers, not ideology. The task now is to understand how these losses affect the economy, why they took time to emerge, and why challenges may persist into the next decade.
The Brexit slow-burning GDP loss
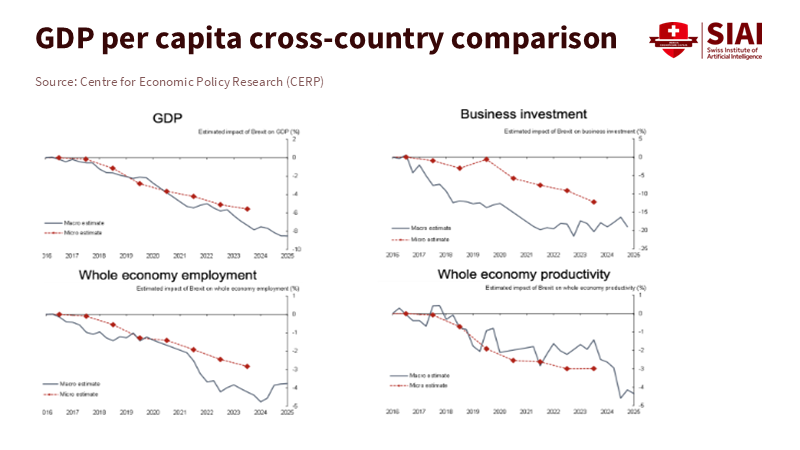
The slow burn is driven by three linked factors: output per person, capital investment, and trade intensity. Recent estimates put the GDP per capita gap at 6-8% by 2025. Investment is down 12 to 18% and productivity is 3 to 4% below the counterfactual. A separate analysis indicates an overall GDP shortfall of about 5% by 2022, which has lingered. The Brexit slow-burn GDP loss shows up in both the levels and the factors that drive long-term growth. There are fewer productive assets per worker, slower idea sharing through trade, and less firm-level learning due to competition in a smaller market.
Official projections remain concerning. The UK’s budget watchdog continues to base its medium-term forecasts on a 15% drop in trade volumes (the total quantity of goods and services imported and exported) compared to remaining in the EU. They also predict an associated 4% decline in potential productivity (the estimated maximum output the UK can achieve with available resources), which should appear fully over about 15 years. The trade shock—meaning the negative impact of changes in trading relationships—has been uneven. UK goods trade has been especially weak compared to peers since 2019, while services performed better. For GDP per person (a measure of average economic output per resident), this mix still results in a loss. These are not one-time adjustments; they push growth to a lower path unless policies and market access change.
Three paths to a smaller economy
First, the trade-investment-productivity link comes into play. Increased friction diminishes market size and competition, leading firms to invest less. This, in turn, slows down idea sharing, harming productivity. The UK missed much of the global trade rebound following the pandemic; its trade intensity remains below 2019 levels, while other G7 countries have recovered or surpassed those levels. Data supports this: goods exports to the EU in 2024 were about 18% lower in real terms than in 2019, and research from the London School of Economics attributes a £27 billion (approximately 6.4%) drop in total goods exports in 2022 to the current trade terms. Business investment has been a significant domestic drag since 2016, underperforming compared to every other G7 nation during the period after the vote. These facts align with the official view that weaker trade lowers productivity by about 4% over the coming years.
Second, the labor-skills link matters. The end of free movement changed the scale and makeup of migration. Many EU workers left during the pandemic and did not return to key sectors like hospitality, food processing, road haulage, and parts of agriculture. Recent inflows have been mostly non-EU and more skilled. This rebalancing benefits some high-skill sectors but has caused lasting shortages and higher costs in lower-wage, essential supply-chain roles. Research focused on the UK and sector evidence from 2023 to 2025 shows persistent shortages in specific occupations tied to these changes. The country’s own migration advisory warns that planned reductions in net migration in 2026 could worsen shortages in sectors such as retail, social care, and hospitality. These labor frictions raise prices and limit output in downstream sectors, reinforcing the slow burn.
Third, regulatory changes and market fragmentation have posed challenges, particularly for goods and certain complex services. The UK has diverged from the EU in several ways; after multiple delays, the UK began complete sanitary and phytosanitary checks and new safety and security declarations on EU imports in 2024, raising costs for just-in-time supply chains. The EU has enforced complete customs checks since 2021. This staggered timeline helps clarify why exporters often faced challenges before importers and why trade effects continued to grow rather than reset. A European Parliament brief highlights this split: EU-UK goods trade remains below pre-Brexit levels in 2023 and 2024, while services trade has performed better. Fragmentation also undermines investment incentives in industries sensitive to scale, such as chemicals and automotive, where rules on origin, testing, and differing standards are significant.
Why did the damage take time to show
The delay in the Brexit slow-burning GDP loss has a few straightforward explanations. The formal transition lasted until December 31, 2020, so many frictions began only in 2021. The UK delayed its border checks until 2024, reducing import-side disruption and muddying price signals. Pandemic rescue packages, the surge after reopening in 2021, and a global energy shock overshadowed early estimates, making it difficult to draw clear conclusions at the time. Additionally, the pound’s depreciation in 2016 buffered some exporters even as it increased import costs for households, complicating the broader economic picture. As the noise lessened and checks became stricter, the underlying trend became clearer: weaker goods trade, reduced investment, and poor productivity compared to the counterfactual.
Measuring impacts takes time as well. Counterfactual modeling requires enough post-event data to establish a stable understanding. By 2024 to 2025, this became possible. Different approaches—structural forecasts, doppelgänger methods, and sector-level natural experiments—converged on a significant and persistent loss. The budget watchdog still expects the full productivity impact to unfold over approximately 15 years, with some effects already evident in the investment slump following the 2016 vote. This illustrates the slow burn: the lack of drama does not mean a lack of damage; it’s damage that accumulates over time.
The next decade—and a U.S. warning
The pressing question is urgent: has the slow burn finally ended? Leading officials issue a stark warning: no. The central bank has repeatedly cautioned that reduced market access will severely hinder growth for the foreseeable future. Meanwhile, the budget watchdog’s 2025 outlook predicts a painful, long-term 15% drop in trade intensity and a 4% decline in productivity relative to the status quo. Evidence from specific sectors is alarming: goods exporters confront persistent obstacles, and the damaging consequences of delays in UK checks only fully emerged in 2024. Heightened uncertainty continues to choke off long-term investments. Without decisive steps to improve market conditions—such as veterinary and SPS agreements, mobility arrangements, or strengthened regulatory cooperation—the next decade is almost sure to bring ongoing hardship.
Additionally, there is a lesson for the U.S. A major bank has cautioned that broad tariff increases and moves away from openness could lead to a slow-burn effect similar to Brexit in America—not an immediate recession, but a gradual slowdown as supply chains adjust and companies postpone capital expenditures. This warning has been echoed in various news reports and analyses throughout 2025, as slower growth projections emerged amid increased tariffs. Significantly, the diversity of ideas, skills, and backgrounds matters as much as tariff levels. The U.S. Congressional Budget Office estimates that the recent surge in immigration could raise nominal GDP by about 3.2% by 2034 compared to a baseline with lower immigration, with additional gains likely from innovation in STEM fields that aren’t fully captured in the headline numbers. Restricting this flow would lead America down a path similar to the UK’s: narrower markets, slower idea sharing, and reduced productivity.
The policy implications are practical. For educators, the case for enhancing cross-border research, industry placements, and student mobility is not just a cultural interest—it’s an economic necessity that increases the chance of knowledge sharing, business growth, and export capabilities among the next generation. For administrators, procurement and partnership rules should promote scale—such as joint degrees, shared labs, and co-funded centers that connect local talent to continental research networks. For policymakers, the to-do list is short and actionable: reduce frictions where possible (starting with SPS and conformity assessments), rebuild mobility for young workers and researchers, and design immigration rules that focus on skills and shortage roles rather than just total numbers. These actions won’t eliminate the slow burn, but they can lessen it quickly enough to affect living standards during this parliament.
Critics are not quiet, and they raise important points. Some argue that UK productivity trends since 2016 resemble the G7's slowdown after the financial crisis; that manufacturing still has strengths in specific areas; and that openness indicators appear unchanged when measured a certain way. However, when we compare higher-frequency trade data, sector studies, investment gaps, and independent doppelgänger results, the main conclusion is clear: the UK has not performed as strongly as it could have under the theory of smaller markets, increased friction, and delayed capital expenditures. There are outliers and brief periods of resilience, but the larger trend remains. It is wise to treat that trend as the baseline and draft legislation around it, rather than hoping it will disappear.
The U.S. debate over tariffs and migration is likely to heat up. If America imposes limits in both areas, it will test the exact mechanisms that harmed the UK: reduced market access and a decline in the diversity of ideas. The CBO’s work, alongside OECD analyses of immigrant entrepreneurship and labor-market integration, shows why this would be a mistake. Immigration boosts output, helps fill shortages, and promotes innovation. Cutting back on that flow while adding trade barriers invites a slow burn of its own. The UK’s experience serves as a warning, not a model.
Countering the Brexit slow-burn GDP loss
Conclusion. Reflect on the central number: a 6-8% gap in GDP per capita is not the cost of a crisis; it is the cost of ongoing friction. This is why the Brexit-induced slow-burning loss of GDP is so significant. It affects wage growth, tax capacity, and public investment; it is subtle enough to be dismissed in any single quarter; and it is persistent enough to shape a decade. The answer is not slogans about sovereignty or re-entry. It calls for a focused plan to enhance market conditions wherever possible, rebuild mobility where it is most beneficial, and use the university-industry links to regain scale, speed, and diffusion in areas of the economy that drive productivity. The warning for the U.S. is clear: keep trade and talent channels open or face a steady decline that no budget trick can fix. The economic reasoning is straightforward; the decision is political.
The views expressed in this article are those of the author(s) and do not necessarily reflect the official position of the Swiss Institute of Artificial Intelligence (SIAI) or its affiliates.
References
Bailey, A. (2025, November). Brexit will continue to drag on UK growth, BoE’s Bailey warns. Financial Times.
Bloom, N., Bunn, P., Mizen, P., Smietanka, P., & Thwaites, G. (2025, December 5). Brexit’s slow-burn hit to the UK economy. VoxEU/CEPR.
Centre for European Reform (Springford, J.). (2022). The cost of Brexit. CER.
Congressional Budget Office. (2024, July 23). Effects of the immigration surge on the federal budget and the economy. CBO.
European Parliament. (2024, November 27). EU-UK trade flows. EPRS Briefing.
House of Commons Library. (2025, April 22). Statistics on UK-EU trade. Research Briefing CBP-7851.
LSE Centre for Economic Performance. (2024, December 18). Brexit reduced goods exports by £27bn – with smaller firms most affected. CEP.
OBR. (2024, March 6). How are our Brexit trade forecast assumptions performing? Box in Economic and fiscal outlook.
OBR. (2025, November). Economic and fiscal outlook – November 2025. (Long-run 15% trade intensity and ~4% productivity assumptions.)
OBR. (n.d.). G7 growth and investment since the EU referendum. (Box note.)
Office for National Statistics. (2024, November 15). UK trade: September 2024. ONS Bulletin.
OECD. (2024, November 14). International Migration Outlook 2024. (Ch. on migrant entrepreneurship and innovation.)
UK in a Changing Europe. (2025, February 6). Five years on and Brexit still defines the UK economy—and will continue to. UKICE.
UK in a Changing Europe. (2025, January 28). The Brexit Files: From Referendum to Reset. UKICE report.
UK Government / Lords Library. (2024, April 26). Border controls for UK and EU imports and exports. Lords Library Note; see also Border Target Operating Model (BTOM) implementation.
U.S. perspective: JPMorgan. (2025, May 11). US risks Brexit-style slow-burning damage from trade shock. Investing.com summary of JPMorgan research; see also Reuters on 2025 tariff risks.
David O’Neill is a Professor of AI/Policy at the Gordon School of Business, SIAI, based in Switzerland. His work explores the intersection of AI, quantitative finance, and policy-oriented educational design, with particular attention to executive-level and institutional learning frameworks.
In addition to his academic role, he oversees the operational and financial administration of SIAI’s education programs in Europe, contributing to governance, compliance, and the integration of AI methodologies into policy and investment-oriented curricula.


Comment