The Economic Cost of War: Why Lost Labor and Capital Crush Recovery

In recent years, his research has extended to the economic and fiscal implications of technological change, including the interaction between artificial intelligence, demographic shifts, and public finance sustainability.
He holds a PhD in Mathematical Finance from Boston University, and previously earned an MSc in Finance and Economics from the London School of Economics. He completed his undergraduate studies in Economics at Seoul National University under the Korea Foundation for Advanced Studies scholarship program.
He regularly contributes analytical essays on the broader socioeconomic implications of AI to The Economy Review.
Input
Modified
War slashes output by destroying labor and capital
Ukraine’s displacement and ruined infrastructure cause long, Europe-wide economic scars
Recovery hinges on safe returns, demining, and rebuilding power and transport to unlock investment

When a country goes to war, the costs don’t just happen once. They add up over the years due to lost people and damaged machinery. One number highlights the issue: Ukraine’s updated reconstruction and recovery needs amount to $524 billion over the next decade, about 2.8 times its 2024 GDP. This is not a plan to stimulate the economy. It’s the cost of replacing destroyed homes, factories, power plants, and public services, before considering any new growth. Adding the 6.9 million refugees abroad and the 3.7 million people displaced within the country shows a scattered workforce and underutilized skills. War exposes a simple truth about production: output depends on both labor and capital. When both decline simultaneously, the economic impact of war increases. No financial aid can replace lost workers or damaged assets. Only restoring communities, clearing landmines, and rebuilding capital can spur recovery. Anything less will leave a permanent mark on national income.
Why is the economic cost of war different from a financial crisis?
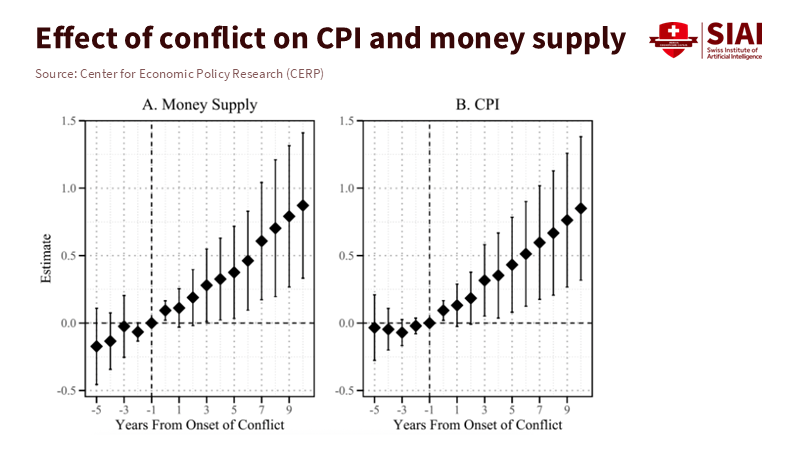
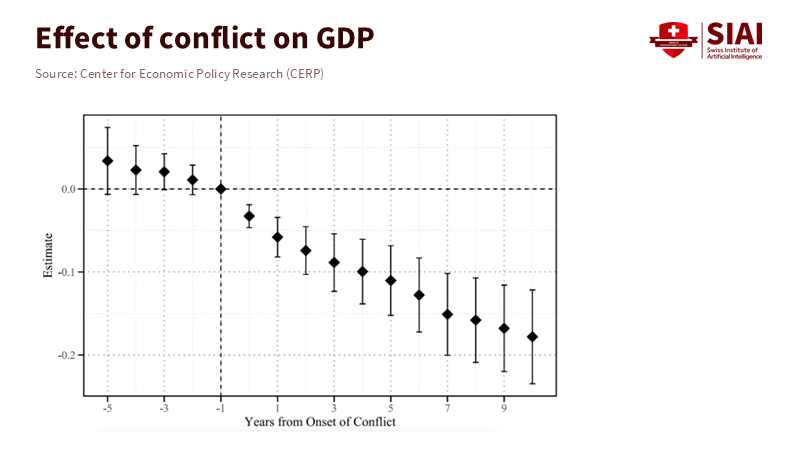
A financial crisis damages balance sheets and erodes confidence. However, most workers stay in place, and the physical capital remains intact. Once prices stabilize and credit improves, investment can bounce back. War is different. It destroys capital and forcefully drives people out of the job market. Spending on weapons diverts resources from equipment that helps produce civilian goods. Research covering 115 conflicts over 75 years shows significant and lasting drops in GDP, investment, and trade, which show no recovery even a decade later. That’s the norm, not an exception. When countries lose fiscal strength and rely on inflationary financing, the adverse effects linger. In simple terms, after a war, the economy shrinks and typically stays smaller unless policies directly address both the labor and capital losses. That’s the actual economic cost of war.
In contrast, crises caused by financial stress often temporarily reduce demand and credit. But the labor supply and productive capacity remain. Studies on financial stress indicate that growth slows and unemployment rises. Yet, these conditions are reversible once confidence, lending, and investment return. The damage from financial issues is real, but it does not combine lost workers and destroyed facilities like war does. Notably, economic crises can attract new capital when assets become cheap. At the same time, war destroys collateral and raises risks, limiting credit availability. This gap is why the economic cost of war is both greater and longer-lasting than a banking crisis.
When we consider production, the enduring and widespread effects of war on the economy become clear. If output, Y, is dependent on labor, L, and capital, K, then a 10% reduction in the workforce due to displacement and mobilization, coupled with a 20% drop in capital from damage and poor maintenance, results in a 28% decline in Y. This calculation doesn't even account for productivity loss from energy outages or landmines. This simplified math aligns with extensive research: wars cause double-digit output losses over many years. In contrast, economies recover more swiftly after financial crises once credit returns. In reality, the combined loss of L and K is often larger than these conservative estimates, which explains why the economic cost of war endures.
Ukraine’s numbers show the scale of lost labor and capital
The human toll is stark. There are 6.9 million recorded refugees globally, and 3.7 million people remain displaced within Ukraine. Temporary protection in the EU is likely to last until 2027, indicating that many will not return soon. Each month someone is away weakens ties to local job markets, degrades skills, and changes family decisions regarding education and work. This represents a structural blow to L. The macro data reflects this strain: real GDP fell by about 30% in 2022, then grew by 5.3% in 2023, with slower growth expected in 2024 and 2025. Growth from such a low starting point doesn’t close the level gap. The country’s population is now around 33 million, with a significant wartime demographic imbalance that will affect labor supply for years. The economic cost of war shows up first in people, then everywhere else.
The capital damage is equally severe. An independent assessment reports direct infrastructure damage at $170 billion as of late 2024, with 13% of the housing stock damaged or destroyed. New attacks have focused on energy infrastructure, leading to a 70% increase in damaged assets since the previous assessment. The $524 billion required over ten years covers more than just concrete and steel; it includes rails, ports, schools, clinics, and a power grid that needs to be rebuilt to be efficient and modern. These are the basic components of productivity. Without them, overall productivity declines, and the return on private investment decreases. This keeps capital formation weak even when credit is accessible, widening the output gap that illustrates the economic cost of war.
Agriculture and industry face a hidden capital loss: land made unusable by mines and unexploded ordnance. One study estimates annual GDP losses of over $11 billion due to mine contamination, in addition to billions more in reduced tax revenue and exports. Clearing mines will take years and require tens of billions in funding. Investors take that risk into account. Meanwhile, companies report staff shortages due to mobilization, blackouts, and logistics disruptions as significant constraints. Official forecasts predict only 2% to 3% growth in 2025, which will not bridge the level gap anytime soon. The economic cost of war thus continues due to a mix of physical damage, safety concerns, and disrupted labor supply that no quick policy fix can resolve.
How the economic cost of war spills across borders
Wars transcend national boundaries. Europe’s energy crisis in 2022 shifted the euro area’s current account from a 2.8% GDP surplus to a 0.8% deficit, marking the most significant annual swing on record. Studies show that energy price shocks were responsible for about 60% of headline inflation at its peak. The EU also faced a terms-of-trade loss, estimated by regulators at roughly 3.3% of GDP in 2021 and 2022, an income transfer abroad due to higher import prices. Economic output slowed and investment weakened as uncertainty rose. These numbers represent the impact of a single war across many economies, demonstrating how the financial cost of war extends far beyond the battlefield.
Corporate and national channels have become easier to measure. A recent multi-country study ties company exposure to the Russia-Ukraine war to ongoing declines in investment among over 6,500 firms. Another report indicates that when conflict intensity increases in a neighboring country, public debt in the home country tends to rise by about 2% of GDP in the initial years. Regional evaluations show how supply chains, remittances, and trade routes amplify these shocks in Eastern Partnership and Central Asian economies. In essence, the economic cost of war spreads through finance, logistics, and expectations, increasing inflation risk and crowding out productive spending far from the conflict zones.
Policy rules for rebuilding L and K
Strategies must be aligned with the production function. First, rebuild the labor force. This means creating incentives and conditions for people to return, such as offers of safe housing, schools, and clinics in areas where families live and work. It also involves formally recognizing qualifications obtained abroad, ensuring pensions are portable, and providing pathways for refugees currently under EU protection. When immediate return is not possible, policies need to reflect reality: expand remote and cross-border work programs so people can earn and pay taxes while outside the country, and establish vocational training that addresses demand in sectors like energy, construction, and logistics. These actions increase L without forcing premature returns. Above all, it’s vital to support teachers and healthcare workers; they are essential to maintaining the human capital that survives war and spurs recovery. The economic cost of war decreases when the labor pipeline resumes.
Second, reduce risks to capital. Begin with the power grid, rail systems, and ports since these attract private investment. Use reconstruction funds to encourage, rather than compete with, private investment: offer transparent tenders, publish project data, and commit to maintenance budgets to prevent assets from deteriorating. Expand war-risk insurance and guarantees to make it easier for foreign direct investment to enter earlier, with loss-sharing from multilateral and export-credit agencies. Fund demining on a large scale; it is capital formation in another form. Clearing every hectare boosts the value of capital on that land. It lowers investor risk—link restoration of property rights to digital registries and fast dispute resolution to restore collateral value. The economic cost of war is a financing challenge, but it’s also about timing. If we prioritize power, transportation, and safety, private investment will follow.
Third, stabilize the macroeconomic framework while being clear about losses. Wars limit fiscal capacity as revenues drop and defense spending rises. Research warns against short-term debt and inflationary financing, which worsen the downturn. Maintain a credible foundation: transparent budgets, disinflation strategies that won’t hinder repairs to power and transport, and exchange rate policies that safeguard reserves for capital goods. External partners can assist by providing upfront grants, protecting social support, and tying funds to measurable asset restoration—beyond just budget figures. This is the demanding work needed to reduce the economic cost of war from a permanent loss to a manageable scar.
The $524 billion figure should not overwhelm us; it should drive our focus. War reduces output by removing workers from jobs and machines from production. That’s why the economic cost of war differs fundamentally from that of a financial shock, and why recovery takes years, even when growth returns at the headline level. The way forward is straightforward in theory, though challenging in practice: rebuild both people and capital together, in the correct sequence, with trustworthy institutions to ensure progress. This requires safe returns, functional power grids, cleared land, and courts that make collateral valuable again. It means sensible macro policies that keep inflation in check without hindering reconstruction. If we follow this plan, we can reduce output losses. If we don’t, the scars will define the next decade—and, at worst, the next fifty years. The equation Y=L×K isn’t just a slogan; it’s a strategy.
The views expressed in this article are those of the author(s) and do not necessarily reflect the official position of the Swiss Institute of Artificial Intelligence (SIAI) or its affiliates.
References
Abdel-Latif, H., et al. (2024). Echoes Across Borders: Macroeconomic Spillover Effects of Conflicts. IMF Working Paper WP/24/100.
Benmelech, E., & Monteiro, J. (2025, Nov. 3). The lasting economic scars of war. VoxEU/CEPR.
CaixaBank Research. (2025, Apr. 22). Ukraine’s reconstruction and its potential energy implications for Europe.
European Central Bank. (2023, June). The euro area current account after the pandemic and energy shock. Economic Bulletin article.
Federle, J., Meier, A., Müller, G., Mutschler, W., & Schularick, M. (2024, Mar. 26). Mapping the economic costs of war. VoxEU/CEPR.
IOM. (2025, Apr.). Ukraine Internal Displacement Report (R20).
KSE Institute. (2025, Feb. 14). Damages to Ukraine’s infrastructure have risen to $170 billion (as of Nov. 2024).
Neri, S. (2023). Energy price shocks and inflation in the euro area. SUERF Policy Brief.
Párraga, S. (2024). The pass-through to inflation of gas price shocks. ECB Working Paper No. 2968.
Reuters. (2024, Sept. 10). Landmines cost Ukraine $11 bn in GDP each year.
Reuters. (2025, Jan. 16). Ukraine’s economic growth to slow to 2.7% in 2025.
UNDP/World Bank/EC/UN. (2025, Feb. 25). Updated recovery and reconstruction needs assessment: $524 bn.
USA for UNHCR. (2025, Feb.). Ukraine Emergency: 6.9 million refugees; 3.7 million IDPs.
European Commission. (2022, Autumn). European Economic Forecast.
IMF. (2025). Ukraine—At a Glance. (2025 growth and inflation projections; population).
OECD. (2023). Economic Surveys: European Union and Euro Area 2023. (Energy shock, growth slowdown).
In recent years, his research has extended to the economic and fiscal implications of technological change, including the interaction between artificial intelligence, demographic shifts, and public finance sustainability.
He holds a PhD in Mathematical Finance from Boston University, and previously earned an MSc in Finance and Economics from the London School of Economics. He completed his undergraduate studies in Economics at Seoul National University under the Korea Foundation for Advanced Studies scholarship program.
He regularly contributes analytical essays on the broader socioeconomic implications of AI to The Economy Review.