Reframing Inflation: Why inflation decomposition must be central to policy and teaching

Ethan McGowan is a Professor of AI/Finance and Legal Analytics at the Gordon School of Business, SIAI. Originally from the United Kingdom, he works at the frontier of AI applications in financial regulation and institutional strategy, advising on governance and legal frameworks for next-generation investment vehicles. McGowan plays a key role in SIAI’s expansion into global finance hubs, including oversight of the institute’s initiatives in the Middle East and its emerging hedge fund operations.
Input
Modified
Inflation is a mix of shocks and trends, not a single number
Inflation decomposition clarifies causes and improves policy decisions
It should be central to both forecasting and economic education

Inflation isn't simple. It's a mix of things that change quickly and slowly, specific industry problems, and overall trends. This has had real impacts recently: the main inflation number and the core inflation number have moved in different directions, housing and services have acted differently than goods, and leaders have struggled to control demand while also dealing with supply issues. If we treat inflation as just one number, we miss these important trade-offs. Looking at inflation in smaller parts—breaking it down by how often it changes and what's causing it—changes how we understand it and how we teach others about it. This isn't just a technical thing; it's a helpful way to look at inflation that improves our predictions, clarifies how monetary policy can help, and gives teachers a clearer way to explain how prices are set in our complicated economy. It’s important because better information means fewer mistakes in policy, and students need to see how actions cause reactions rather than just focusing on one overall number.
Inflation Decomposition: A Closer Look at What Inflation Is
The easiest mistake is to look at the main inflation number and think everything is affected the same way. This was a problem after the pandemic, when prices for goods, resources, and housing changed in different ways. By breaking down inflation by frequency and by supply and demand, we can see which changes are temporary and which are permanent.
Frequency methods separate short-term noise (such as temporary price changes caused by the pandemic) from medium-term changes (related to the business cycle) and long-term trends (such as wages and structural costs). Analyzing inflation this way shows that different things matter at different frequencies: credit spreads, resource shortages, and tight markets matter more in the short term, while wages and overall cost trends matter more in the long term. This is important because our policy tools have different effects on these different frequencies. Interest rates affect overall demand, which helps address medium-frequency demand issues, but they don't do much to address supply shocks driven by global energy markets. Teachers who use decomposition teach their students to first ask what frequency is moving and why, before suggesting solutions.
Looking at supply and demand is also very helpful. Methods that use prices and quantities to label months or industries as demand-driven or supply-driven produce two series: one measuring the inflation caused by demand and another by supply. These series act as expected: demand-driven contributions decrease in recessions and respond to monetary policy, while supply-driven contributions increase with resource shocks and supply-chain problems. This is crucial for policy: if most current inflation is supply-driven, raising rates too much could cause a recession without fixing inflation. If it's demand-driven, raising rates is the right move. Teaching this method in classrooms changes the question from " How high is inflation? to what kind of shock is moving prices now? and encourages students to match solutions to the right problems.
Inflation Decomposition: Methods That Actually Improve Forecasting and Clarity
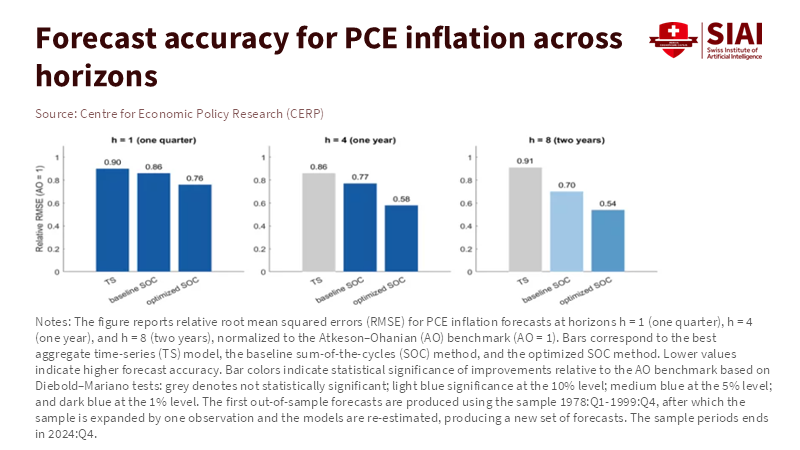
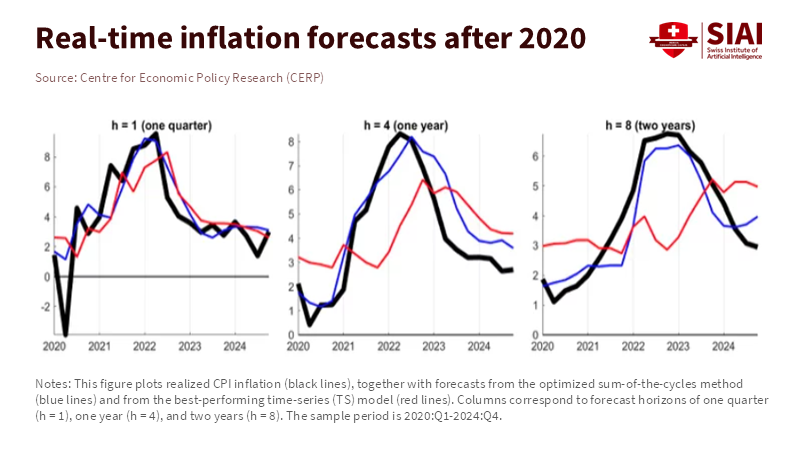
The test of any good method is whether it improves predictions and understanding. Frequency-aware forecasting decomposes inflation into components and uses models tailored to each component. When combined, these predictions often outperform single-model approaches that treat inflation as a single factor. This is a big benefit: frequency-based strategies reduce mistakes in medium and long-term forecasting and show which things matter at each point—financial variables for short cycles, Phillips-curve inputs for medium cycles, and structural indicators for long-term trends. These benefits matter for central banks that need to make predictions six to twenty-four months in advance and for teachers who want students to see how model choice affects forecasting.
Looking at supply and demand shows how to use this idea with monthly data. By running separate regressions of price and quantity and imposing sign restrictions, researchers can determine whether price changes were driven by demand or supply. Adding these labels together gives a continuous breakdown of overall inflation. This is helpful in two ways. First, leaders get a real-time measure of which contribution is dominant. Second, forecasters can use different models for demand and supply, which improves both accuracy and understanding. This method also works well in simulations: monetary shocks decrease the demand-driven share, while oil supply shocks increase the supply-driven share, as expected. This consistency builds trust in the methods and makes them easier to teach.
Inflation Decomposition: What Sectoral Tools Teach Us About Persistence
Sectoral tools add another dimension. The Multivariate Core Trend (MCT) approach estimates how long inflation persists across industries and whether it's common or specific to each industry. This gives two useful pieces of information: a measure of trend (persistence) and the sectoral makeup of that persistence. The MCT is updated monthly and separates housing, services, and goods, helping users see if persistence is focused or broad. For leaders, a broad, persistent signal means a stronger policy response is needed, while a sectoral, temporary signal suggests a lighter touch or targeted measures. For teachers, showing students a sectoral breakdown helps connect theory and real-world prices. Students can quickly test scenarios and see if rents or durables are driving persistence in a given quarter.
This sectoral view paid off during the pandemic. Many industries experienced large temporary shocks that, when combined, made persistence seem worse than it was. Multivariate trend measures filtered out this noise and reduced confusion by showing that some industries were temporarily affected, while others faced more lasting pressure. The teaching point is simple: teaching aggregate models without sectoral breakdown leaves students unable to explain why the same inflation numbers can call for different policies. Using sectoral tools in curricula trains students to test for breadth and persistence before recommending policies.
Inflation Decomposition: What This Means for Policy, Classrooms, and Likely Critiques
For leaders, methods that separate frequency bands and label supply versus demand provide a way to make decisions that reduce policy errors. When decomposition shows demand-driven inflation is dominant, raising rates is likely to work. When supply shocks dominate, fiscal policy or targeted supply interventions may be better. This strategy is precise, not passive. Central banks now use several methods—from trimmed-means and median measures to multivariate trend indexes—that reduce reliance on any single metric. This variety is what decomposition encourages: different tools for different questions.
For teachers and program designers, curricula should require students to decompose series and build models that forecast each component. Exercises should include frequency filtering, sectoral factor models, and supply/demand label exercises using category-level data. This isn't just a toolbox; it's the core of applied macro policy. Critiques will focus on complexity and data revisions. Decomposition requires more data and computation, and monthly revisions can change conclusions. These are real issues, but they can be overcome. Frequency decomposition and sectoral dynamic-factor methods are computationally lighter than machine learning. Transparency—publishing methods and code—reduces revision risk by allowing quick checks. And decomposition shows where uncertainty remains, which is better than hiding it behind one number.
Some will say that decomposition makes the story confusing. That's a valid concern: communicating these ideas requires clear teaching and visuals. The solution is simple summaries: a dashboard showing (a) headline rate, (b) demand-driven share, (c) supply-driven share, and (d) frequency contributions. Students who can read this dashboard will be better communicators and policy advisers than those who only recite a headline. This isn't just theoretical: cross-country decompositions reveal stable patterns in which supply spikes align with resource shocks and demand shares rise with policy, suggesting that decomposition yields useful signals.
Teach, Measure, and Act on the Many Faces of Inflation
Inflation is complex. Decomposition—by frequency, supply and demand, and sector—allows us to describe this complexity. This improves forecasting, clarifies which policies will work, and trains students to match evidence to solutions instead of reflexively calling for broad measures. The steps are simple: central banks and agencies should keep publishing sectoral and supply/demand series; programs should require decomposition exercises; and policy teams should use dashboards to make decisions that show the dominant drivers before committing to big changes. The result is fewer policy errors, better communication, and a generation of analysts who see inflation as a signal, not a blunt instrument. If we want a policy that is effective and believable, we must teach precise methods. That is the need for inflation decomposition, and it's something we can do now.
The views expressed in this article are those of the author(s) and do not necessarily reflect the official position of the Swiss Institute of Artificial Intelligence (SIAI) or its affiliates.
References
Bank of Finland. (2021). Inflation dynamics and forecast: Frequency matters. Bank of Finland Discussion Papers.
Bureau of Labor Statistics. (2026). Consumer Price Index – December 2025.
Firat, M., & Hao, O. (2023). Demand vs. supply decomposition of inflation: Cross-country evidence with applications (IMF Working Paper 2023/205).
Federal Reserve Bank of San Francisco. (2024). Shapiro, A. H., Decomposing supply and demand driven inflation (Working Paper 2022-18).
Federal Reserve Bank of New York. (2023). Multivariate Core Trend (MCT) Inflation (Applied Macroeconomics & Econometrics Center).
GREDEG. (2023). Ciambezi, L., Rethinking inflation in an agent-based macroeconomic model (GREDEG Working Paper No. 2023-14).
Ethan McGowan is a Professor of AI/Finance and Legal Analytics at the Gordon School of Business, SIAI. Originally from the United Kingdom, he works at the frontier of AI applications in financial regulation and institutional strategy, advising on governance and legal frameworks for next-generation investment vehicles. McGowan plays a key role in SIAI’s expansion into global finance hubs, including oversight of the institute’s initiatives in the Middle East and its emerging hedge fund operations.


Comment