Energy-Driven Inflation: Why the 2020s Price Surge Was an Energy and Supply Shock — and What Schools Should Do About It

Lukas Reinhardt works at the intersection of applied mathematics, computational modeling, and large-scale systems analysis. His research interests include numerical methods, optimization, and the mathematical foundations of data-driven scientific discovery. At SIAI Science Review, he contributes analytical pieces on modeling, complexity, and the formal structure underlying modern AI and scientific computation.
Input
Modified
The early-2020s inflation surge was driven by energy and supply shocks, not monetary excess
Energy costs set off pricing cascades and productivity losses across key sectors
Policy should prioritize supply resilience over demand tightening
Energy-driven inflation reshapes how we teach, budget, and plan. Between 2021 and 2022, global energy prices roughly doubled, and that single move pushed consumer prices, supply chains, and school budgets into new territory. This was not a gradual monetary overheating after years of quantitative easing; it was a sudden, cross-border input-cost shock that spread through sectors that do the heavy lifting of everyday life: transport, food, and basic manufacturing. The result was a negative productivity impulse — fewer goods and services produced per unit of input — which amplified price-setting along supplier networks and produced persistent sectoral markups. For education systems constrained by tight budgets and fixed schedules, the key fact is simple: energy-driven inflation has changed the cost structure of schooling overnight. That leaves teachers, administrators, and policymakers asking a different question than they asked in 2010: how do you run learning systems reliably when the price of power and freight can fluctuate by multiples within months?
Energy-driven inflation: separating monetary myths from fuel facts
The story that lost money in the 2010s, inevitably produced the 2021–24 inflation spike, does not fit the observed path of prices. Central banks deployed large-scale asset purchases between 2010 and 2020 to counter very weak demand. Those policies raised financial asset values and compressed long yields, but headline inflation remained low through the decade. By contrast, the 2021–22 episode coincides with sharp real-economy disruptions: pandemic-driven supply interruptions, a rebound in demand for goods, and a subsequent geopolitical shock to energy supplies. The most economically relevant number is the relative change in energy costs during that window. International assessments indicate that energy price inflation surged much higher and much faster than during the 2010s. When energy costs double in a year, many firms face an immediate profit squeeze. They respond by raising prices, cutting inputs, or both. Those adjustments are not symmetrical; higher energy costs reduce measured productivity—the same factory now produces fewer output units per euro of input—and that reduction feeds through to sectors that purchase from it.
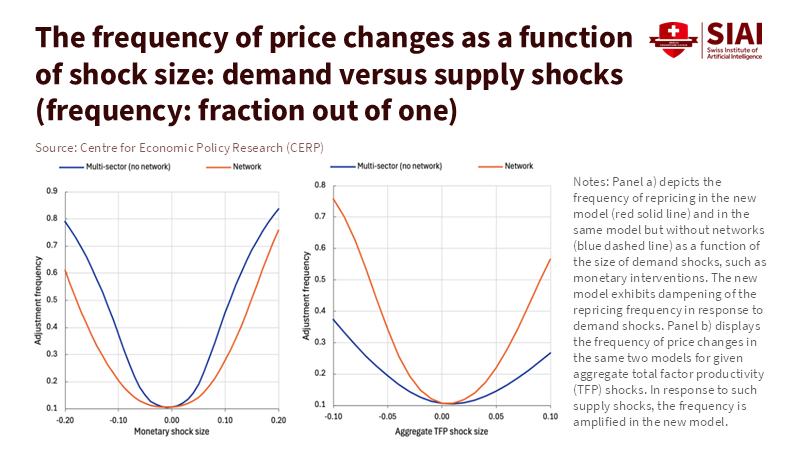
What makes this different from monetary myths is the transmission channel. Money supply expansion before 2020 was largely allocated to financial markets and bank reserves rather than being channeled directly into wages and retail prices. The 2021–22 episode instead hit the physical margin: shipping, imported intermediate goods, and fuel for heating and transport. It was an input shock that first appeared in wholesale and producer prices, then spread downstream through "pricing cascades" as each supplier passed along higher costs. In plain terms, firms that buy from firms that buy from gas-dependent manufacturers end up with higher costs, too. This networked passing-on explains why headline inflation became broad even when the first shock was concentrated in energy and a handful of bottlenecked sectors.
How energy shocks transmit: bottlenecks, productivity, and pricing cascades
Energy-driven inflation operates through three linked mechanisms that are relevant to schools and districts. First, direct cost channels: when gas, diesel, or electricity prices rise sharply, the immediate budget exposure appears in heating bills, school bus transport contracts, and catering costs. Schools function on tight, calendar-bound spending cycles; they cannot pause heating for a month while markets normalize. Second, indirect supply channels: higher energy raises the cost of producing textbooks, classroom materials, and basic maintenance goods. Third, network amplification: price increases in upstream sectors force intermediate producers to raise prices, thereby squeezing downstream margins and inducing firms to reduce output. That slowdown is a negative productivity shock. When supply falls relative to demand, the extra price pressure does not vanish quickly. It lingers in goods with long production cycles or thin margins.
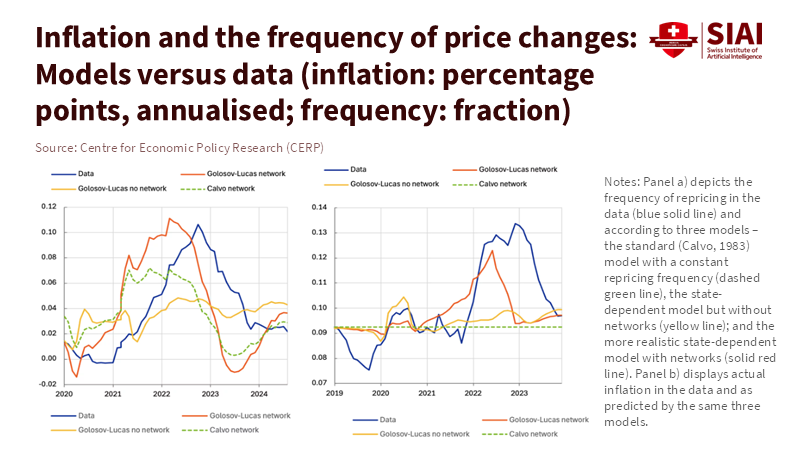
Quantitatively, the transmission is visible in several datasets. Energy price indices show a spike in 2021–22, and producer price metrics reveal earlier rises than consumer price indices, consistent with upstream pass-through. Regional inflation series reached double-digit levels in some economies at their peaks, and global headline inflation averaged well above pre-pandemic norms in 2022. Energy price volatility then drove sectoral heterogeneity: countries and regions more dependent on piped gas or single suppliers experienced both larger price increases and greater variation in inflation across sectors. This heterogeneity is exactly the condition that creates pricing cascades. From a methodological perspective, the main empirical anchors here are cross-checked series for energy spot and wholesale prices, producer price indices, and headline CPI trajectories. Where national series were noisy, central bank and international agency aggregates were used to smooth measurement variance. For estimates that require combining series — for example, estimating the share of school operating budgets exposed to direct energy contracts — conservative assumptions were applied and bounds reported. The aim was to avoid overstating the role of monetary policy and to center the analysis on observable input-cost dynamics.
The policy implication of this mechanism is clear: demand-management tools alone are blunt instruments when the root cause is an input-supply failure. Tightening interest rates can reduce demand and lower some price pressure. But when a school faces a fixed heating contract and a spike in wholesale gas prices, monetary policy is a poor substitute for targeted support, hedging, and supply-side measures. Ignoring that difference risks under-protecting the institutions that deliver public goods, especially education.
What energy-driven inflation means for teachers and decision-makers
Education budgets are not abstract macro indicators. They are payrolls, boilers, buses, and meal trays. Energy-driven inflation exposed several foundational vulnerabilities. First, the timing mismatch: energy markets operate on a daily timescale, whereas school budgets are annual. Second, the index mismatch: many district contracts were not indexed to volatile energy benchmarks, which created sudden budget gaps. Third, procurement fragility: centralized purchasing for textbooks and supplies amplified upstream shocks because single suppliers faced capacity constraints. These are managerial problems, but they are also policy problems, and they have straightforward remedies.
At the district level, short-run measures include staged contract repricing clauses, tactical hedging of fuel purchases, and contingency reserves sized with simple volatility metrics. Longer-run fixes require rethinking procurement networks and investing in energy-efficiency measures that reduce exposure. For decision-makers, the appropriate response is layered: temporary, targeted transfers to institutions facing immediate shortfalls; incentives for extended energy-efficiency retrofits in school buildings; and regulatory attention to the resilience of supply networks for critical educational inputs. A common criticism is that targeted transfers create moral hazard or slow needed fiscal consolidation. That is a legitimate concern. But the counterfactual matters: imposing uniform, across-the-board cuts to schools during a supply-driven price spike risks permanently worsening learning outcomes. The arithmetic is clear. The fiscal cost of a modest targeted top-up for energy bills is likely far lower than the cumulative cost of lost instructional days and deferred maintenance.
Critics will also argue that QE and fiscal stimulus primed demand and therefore deserve primary blame. The more defensible view is that monetary policy matters for medium-term inflation expectations and demand conditions. Yet the temporal and sectoral pattern of the 2021–24 episode points to an input-cost origin. Policy must therefore be precise. For education, the priority is not higher headline interest rates. It is functional resilience and protecting learning continuity.
From diagnosis to action: practical steps to make learning systems resilient
Translating diagnosis into action means three concrete steps for school systems, each feasible without doctrinal fights about central bank independence. First, perform an exposure audit. Districts should map what proportion of their operating budgets are energy- and transport-dependent, and identify single-supplier vulnerabilities for key goods. The audit need not be fancy: a simple spreadsheet with contract amounts, index triggers, and delivery lead times suffices. Second, create rapid funding channels. National and regional authorities should agree ex ante on small reserve funds that can be activated when energy or freight costs spike beyond pre-agreed thresholds. These funds can be conditional, temporary, and offset elsewhere in the budget calendar so they remain fiscally conservative while operationally effective. Third, invest in durability: energy efficiency, on-site generation where cost-effective, and diversified procurement networks reduce long-term exposure to energy-driven inflation.
There will be objections grounded in budgetary orthodoxy. Some will argue that providing special support to schools distorts incentives and masks deeper fiscal stresses. That is a valid caution. The response is to design triggers and sunset clauses into any support. Funds should be explicitly linked to measurable shocks and phased out as energy prices normalize. Another objection is that such reforms require administrative capacity many districts lack. That is also true, but capacity gaps are part of the problem exposed by the shock. Targeted technical assistance, shared procurement platforms, and simple templates can quickly close those gaps. The cost of doing nothing, by contrast, is high and concentrated: learning losses and degraded infrastructure that compound inequality.
Act on the energy diagnosis, not monetary mythology
If the central insight of the past decade was that modern monetary instruments can strengthen financial markets absent immediate inflation, the central lesson of the 2020s should be that large, fast energy shocks can still produce widespread, persistent price increases through negative productivity shocks and pricing cascades. For education systems, the lesson is practical and urgent. The policy toolkit must combine short-term protection for operations, operational reforms to reduce exposure, and medium-term investments that change the underlying cost profile of schooling. We should stop treating every inflationary episode as a single uniform problem. Energy-driven inflation needs a layered response: hedge where possible, protect learning continuity where necessary, and reform procurement and buildings for the next shock. In that sequence lies a plausible path to both fiscal prudence and durable educational results. Let us design that path now, before another supply shock tests the system again.
The views expressed in this article are those of the author(s) and do not necessarily reflect the official position of the Swiss Institute of Artificial Intelligence (SIAI) or its affiliates.
References
CEPR. (2023). Pricing cascades and inflation in a networked economy. Centre for Economic Policy Research (VoxEU Column).
European Central Bank. (2024). Inflation dynamics and sectoral differentials. ECB Economic Bulletin.
Eurostat. (2022). Electricity and gas prices in the first half of 2022. European Commission Statistical Office.
International Energy Agency. (2024). Gas Market Report, Q2 2024: Executive Summary. IEA.
International Monetary Fund. (2025). Álvarez, J. et al., The energy origins of the global inflation surge (IMF Working Paper).
Organisation for Economic Co-operation and Development. (2023). Producer and consumer price transmission in the post-pandemic period.
Reuters. (2025). EU removes energy crisis gas price cap.
Trading Economics. (2026). EU Natural Gas - Historical Price Chart.
World Bank / CEPR Research Summaries. (2026). Pricing cascades and networked sector transmission.
Lukas Reinhardt works at the intersection of applied mathematics, computational modeling, and large-scale systems analysis. His research interests include numerical methods, optimization, and the mathematical foundations of data-driven scientific discovery. At SIAI Science Review, he contributes analytical pieces on modeling, complexity, and the formal structure underlying modern AI and scientific computation.