Counting the Uncounted: Pricing Climate Spillover Costs in Advanced Economies

Ethan McGowan is a Professor of AI/Finance and Legal Analytics at the Gordon School of Business, SIAI. Originally from the United Kingdom, he works at the frontier of AI applications in financial regulation and institutional strategy, advising on governance and legal frameworks for next-generation investment vehicles. McGowan plays a key role in SIAI’s expansion into global finance hubs, including oversight of the institute’s initiatives in the Middle East and its emerging hedge fund operations.
Input
Modified
Climate spillover costs spread climate damage across borders and supply chains, not just disaster zones
Standard models miss these externalities, so budgets and prices understate true risk
Measure and price spillovers to fund resilience in education and public services now

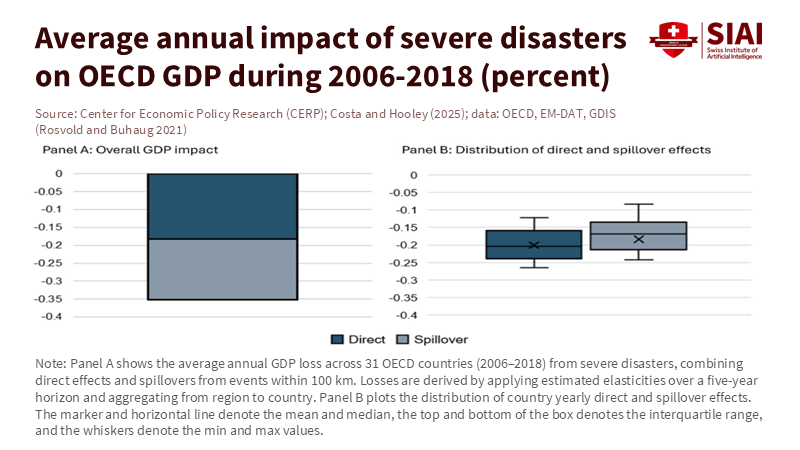
The most critical number you did not budget for this year is 0.3. That is the estimated share of annual GDP that advanced economies lose to extreme weather, including knock-on effects beyond the disaster zone. Roughly half of that loss occurs somewhere else. When ports flood in one area, factory shifts may stop three countries away. A heatwave can lower river levels and raise power prices across a region. These are what we call 'climate spillover costs'. They are the indirect economic impacts of a climate event that spread through supply chains, finance, and public perception. They often go unnoticed in most dashboards. These costs are also increasing with each local storm that has global repercussions. If we keep viewing these costs as someone else’s problem, we will continue to overlook the real price of climate risk. The solution is not just a better disaster fund. We need to measure and price these spillovers—the externalities we have ignored—and redesign policy and markets so that damage across borders is recognized just as broken roads are. Recent evidence indicates that these costs are significant, rising, and partially avoidable if we take action now.
Why climate spillover costs break our standard models
Education policymakers, finance ministries, and central banks still depend on demand-and-supply curves that assume shocks are local, prices adjust, and the rest of the economy moves on. This approach, which we refer to as the 'standard model', fails when climate shocks spread through trade and financial links faster than contracts and budgets can keep pace. Empirically, extreme weather now causes global catastrophic losses totaling hundreds of billions of dollars each year. Insured losses alone have surpassed $100 billion for several consecutive years, reaching about $137 billion in 2024. These figures increase even without a 'record-setting' hurricane, as medium-sized storms impact larger, more interconnected areas. This explains why climate spillover costs are a systemic issue, not just a peripheral one for coastal regions. They strain logistics and energy capacities and quickly affect the prices that households and schools face far from the disaster zone.
Standard welfare analysis also falls short because the price and quantity of external harm—missed classes from smoke pollution, skill losses due to prolonged heat stress, or the risk premium in municipal bonds—are not clear variables in the supply-and-demand framework. A region’s direct output loss is often the smallest part of the overall picture. A 2024 European Central Bank study shows that trade networks can amplify climate-related GDP losses several times as shocks travel through input-output connections. The essence of climate spillover costs is that indirect damage often exceeds direct damage through both real and financial channels. When we focus solely on what is visible, we underinvest in resilience and misprice risk.
What the latest evidence shows about climate spillover costs
Recent research across advanced economies estimates that extreme weather leads to annual output losses averaging about 0.3% of GDP. Roughly half of that loss occurs outside the disaster area due to negative spillovers. This is not an outlier result; it aligns with new spatial studies that find measurable output declines in nearby regions even if they escape direct damage after a severe disaster. Losses can also linger. Current estimates suggest multi-year impacts on regional GDP following the initial shock. Simply put, climate spillover costs arrive quickly, spread widely, and stick around. Policymakers focusing only on direct damages will consistently fall short.
These spillovers affect prices, not just quantities. IMF research shows how weather anomalies increase supply chain pressures and drive up inflation. This effect is most potent when energy or transport bottlenecks occur, leading to higher utility bills and procurement delays for schools and universities. Insurers convey a similar story from another perspective: insured catastrophe losses reached around $137 billion in 2024 and may approach $145 billion in 2025 if current trends continue; overall economic losses are much higher. Private coverage does not fill the gap; it highlights it. Climate spillover costs largely go uninsured, landing instead on public budgets and households—tuition hikes, delayed maintenance, and program cuts.

A welfare lens on climate spillover costs
Suppose we recognize that climate spillover costs are externalities, the welfare analysis changes. The social cost of a heatwave goes beyond just factory outages. It includes the overall productivity decline in the region, cross-border price spikes, and the resulting debt pressure. Welfare analysis needs to shift from local partial equilibrium to a broader network view. Practically, this means adapting cost-benefit analysis to include secondary effects: the loss of instructional time from smoke-day closures, wage erosion in affected labor markets, and higher borrowing costs for municipalities due to supplier exposure. Spatial studies already reflect this thinking. They show that a disaster’s impact extends beyond 100 kilometers and that the economic impact can last for at least 5 years. For education systems, those five years can encompass an entire student’s journey from entry to graduation.
This welfare perspective also reframes macro-stabilization. Monetary authorities correctly worry that repeated climate shocks can complicate efforts to control inflation by increasing volatility and perpetuating instability through service prices. Fiscal authorities also rightly fear that contingent liabilities tied to relief, reconstruction, and supporting local utilities will keep debt levels high. The correct response is not to step back from climate action just because the accounting is complex. We must price climate spillover costs where they emerge and fund adaptation with the same rigor we apply to core infrastructure. This includes national resilience funding connected to supply-chain hubs, not just disaster zones; pre-arranged risk finance for schools and hospitals; and incentives for firms that integrate cross-border externalities by diversifying essential inputs.
Policy design that prices climate spillover costs without stalling growth
The first step is measurement. National accounts should publish an annual climate spillover account that tracks indirect losses through trade, finance, and labor markets. The methods available include input-output models that the ECB and others use to identify cascading losses and value them. Education and health ministries should be key users, as their services are essential and cannot pass increased costs without causing social harm. This account should influence fiscal rules so that resilience spending that reduces climate spillover costs is viewed as an investment with long-term payback, not just an extra expense. Clear metrics will also enable credit rating agencies to reward jurisdictions that reduce network vulnerability, such as by strengthening logistics hubs or greening campus energy.
The second step is market alignment. Climate spillover costs are classic externalities that need pricing. While carbon pricing is necessary, it is not enough; it does not address the distribution of acute physical risk. Two tools can help. First, mandatory climate-risk stress tests for large public buyers—such as university systems, school districts, and hospital networks—should simulate supply shocks at key points and require contingency procurement. Second, parametric insurance at regional or national levels can offer quick payouts when smoke, heat, or flood thresholds are reached, preventing cash-flow crises that lead to layoffs or tuition increases. Both tools can reduce the magnitude and duration of spillovers. Insurer data show the trend: medium-severity events are causing rising, chronic losses. When liquidity quickly arrives and substitutes are pre-approved, the cascade of effects stops sooner. This is an actual growth policy, not just a safety policy.
For educators and administrators, the operational strategy follows from these economic insights. Map your academic calendar and critical services against regional climate risks and supplier locations, not just your local weather. Align procurement with resilience goals: diversify learning materials across regions, maintain a 60- to 90-day supply of essentials like lab supplies and filtration media during peak-risk seasons, and shift energy contracts toward options that include onsite or community-based generation with microgrid potential. For policymakers, the challenge is to remove the barriers that make these adjustments costly. Expand public purchasing frameworks that incentivize supply-chain diversification and set resilience standards. Fund district-level monitoring of air quality, heat stress, and utility outage risks. Tie grants to action plans that ensure students remain in class during shocks. Adaptation is not just about sea walls; it involves better contracts, smarter inventories, and clean, resilient energy.
We began with a figure of 0.3% of GDP and a stark reality: half of the loss impacts areas that avoided the storm. This is the nature of climate spillover costs and explains why standard models underestimate risk. The evidence is no longer uncertain. Extreme weather results in ongoing output declines in regions, price pressures move through supply chains, and insured losses remain at persistently high levels. We cannot rely solely on disaster relief funding, nor can we rely on good intentions to regulate the problem away. However, we can change the accounting and the incentives to ensure that investing in resilience pays off. This requires explicitly measuring spillovers, integrating them into welfare analysis and fiscal planning, and pricing them at the decision-making level for public buyers and private companies. If we do this, the next storm will still cause damage, but we can ensure it won’t catch everything and everyone off guard. Systems will be ready, keeping students in class, maintaining power, and paying a fair price upfront to avoid higher costs later.
The views expressed in this article are those of the author(s) and do not necessarily reflect the official position of the Swiss Institute of Artificial Intelligence (SIAI) or its affiliates.
References
European Central Bank. (2024). Amplification of climate-related physical risks through input–output linkages (ECB Working Paper No. 2942).
International Monetary Fund. (2024). Weather Anomalies, Supply Chain Pressures and Inflation (IMF Working Paper 2024/079).
International Monetary Fund. (2024). World Economic Outlook: October 2024, Chapter 1.
OECD. (2025). The macroeconomic implications of extreme weather events. Paris: OECD Publishing.
Swiss Re Institute. (2024). sigma 1/2024: Natural catastrophes in 2023. Zurich: Swiss Re Institute.
Swiss Re Institute. (2025). sigma 1/2025: Natural catastrophes—insured losses on a high plateau. Zurich: Swiss Re Institute.
Swiss Re Institute (Press Release). (2025, April 29). Hurricanes and earthquakes could lead to global insured losses of USD 300 billion in a peak year.
VoxEU/CEPR. (2025). Macroeconomic implications of extreme weather events: Insights from advanced economies.
Ethan McGowan is a Professor of AI/Finance and Legal Analytics at the Gordon School of Business, SIAI. Originally from the United Kingdom, he works at the frontier of AI applications in financial regulation and institutional strategy, advising on governance and legal frameworks for next-generation investment vehicles. McGowan plays a key role in SIAI’s expansion into global finance hubs, including oversight of the institute’s initiatives in the Middle East and its emerging hedge fund operations.