The Perils of the Now: How to Stop Real-Time Data from Making Policy Worse

Input
Modified
Real-time data can mislead because overload and autocorrelation turn noise into policy
Treat fresh numbers as estimates: blend vintages (replay-style), weight by revision risk, and require causal identification
Teach revision-aware literacy and measure decisions by how well they age, not how fast they react

In February of this year, the US quietly revised its payroll count to remove 598,000 jobs from the previous year's total. This annual revision changed what seemed like steady growth into something much less reassuring. That one adjustment is about six monthly payroll reports disappearing at once. At the same time, the UK's national accounts have changed the pandemic story multiple times. Most recently, revisions increased GDP levels in mid-2024 and slightly raised cumulative real growth since 2020. This serves as a reminder that yesterday's "weak" can become tomorrow's "less weak" due to new methods and data sources. These are not just rounding errors; they represent significant changes with policy implications. When leaders base decisions on preliminary readings, the reality they observe is often harsher, softer, or simply different from what later data will show. The issue isn't using data; it's treating the latest figures as the most accurate and reacting too quickly to their fluctuations.
The critical perspective now is not that real-time indicators are useless—they are crucial. However, they are systematically biased by the way humans and models handle immediacy. When time is short and stakes are high, too many inputs can cloud judgment. Rapid data releases are often autocorrelated and frequently revised, which can turn temporary shocks into misleading trends. To address this, we need to redesign our decision-making process to incorporate recent information without becoming overly reliant on it. In machine learning, deep Q-networks (DQN) tackled a similar challenge by training on "replay buffers," which mix older and newer experiences to avoid harmful correlations. In policy, we need a similar approach: consider the past alongside the present, build awareness of revisions into models, and ensure causal identification when events overlap. The aim isn't to gather less data, but to have more reliable data—processed to withstand the pressure of the moment.
When More Data Makes Us Worse
Research indicates that there is a point at which adding information actually reduces decision quality. In fast-moving situations, the presence of multiple signals creates a higher cognitive load. People start using shortcuts, overemphasize unreliable cues, and confuse noise for meaningful information. A recent review in psychology found that information overload leads to worse understanding, lower satisfaction with choices, and a greater tendency to rely on heuristics. In the policy world—where urgency, public oversight, and various incentives collide—these effects are amplified. Social media environments introduce a level of fatigue that makes individuals more susceptible to misinformation, leading them to prioritize what is easily accessible over what is truly reliable and credible. The more data we accumulate without redesigning how to filter and present it, the more likely we are to create reactive rather than thoughtful policies.
What does this mean for educational systems that teach evidence-based decision-making? It means that "more charts" does not equal "better analysis." Literacy now includes understanding the age of data, how revisions work, and the difference between early estimates and established truths. Students and administrators need to learn how to create "uncertainty budgets," which are specific margins for error laid out before meetings, not just after disappointing headlines. They need to see examples of disciplined delays—deliberate pauses that encourage groups to consider the risks of revisions against the costs of acting. The cultural shift is slight but significant: we should reward consistency of judgment across different datasets, rather than the speed of reactions to the latest figures.
Autocorrelation, Revisions, and the Pseudo-Precision of the Now
Economists are aware that initial releases are often revised, but the scale and direction of recent changes have been impactful for policy. In the US, the Bureau of Labor Statistics' annual payroll benchmark typically adjusts employment levels using near-complete tax data. This February, the final revision decreased job growth by 598,000 over the twelve months ending in March. Over a more extended period, the BLS notes that benchmark revisions average around 0.2% of total nonfarm employment. However, outliers matter in real time because decisions depend on levels, not averages. Treating initial payroll numbers as exact is a misunderstanding; they are valuable signals that require humility and caution.
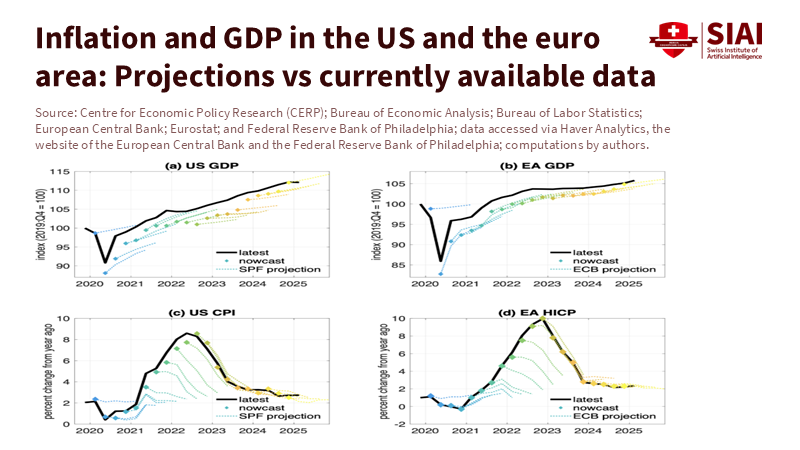
National accounts provide a similar view. The UK's Blue Book updates have altered the pandemic narrative multiple times, including a 2024 release that raised nominal GDP levels and revised cumulative real growth upwards by about half a percentage point since 2020. In 2025, ongoing changes and issues within the Office for National Statistics continued to adjust the picture, highlighting the fragility of some high-frequency data after the pandemic. Across the Channel, quick euro-area GDP estimates are meant to be rapid, not final; revisions are a standard part of the process. The key takeaway is simple: today's data are not just errors waiting to be fixed; they are estimates waiting to be finalized. Policies that recognize this difference should include buffers.

Forecasts have also encountered problems. The ECB's reviews attribute many early inflation projection mistakes to incorrect predictions of energy prices. The Bank of England commissioned an independent review led by Ben Bernanke that identified "significant shortcomings" in forecasting methods. At the same time, nowcasting research from the Cleveland Fed shows that model-based, mixed-frequency approaches can outperform human consensus, yet they still face the revision issue. What matters is not just the model's accuracy at a point in time, but its resilience as source data are updated. Any real-time framework that fails to assess and communicate revision risk as clearly as the central estimate will continue to produce confident errors.
From Data Heat to Policy Light
How can we improve this situation? We can start by borrowing from reinforcement learning's Experience Replay. DQN agents stabilize by storing prior "experiences" and mixing them with new ones, breaking the correlation in sequential data and preventing overfitting to recent shocks. Prioritized replay goes further by sampling transitions that provide higher learning value more often, while also correcting bias with importance weights. The policy equivalent is a "vintage-balanced" evidence protocol: every decision set intentionally combines various data sources, with sampling weights that favor series with low past revisions and penalize those with high fluctuations. Practically, this means we don't allow one noisy data point to dominate the discussion, and we formalize this restraint instead of relying on intuition.
Next, we need to distinguish "signal about the state" from "signal about the mechanism." When policy and outcomes influence each other, simultaneity is common. Instrumental variable (IV) strategies, which are well-known in economics, are underused in everyday policy analysis. They shouldn't be. If we are examining whether a wage subsidy lowered measured unemployment, we need external factors that influenced the subsidy or its impact. Modern macroeconomics offers a range of usable instruments, such as weather-related energy supply shocks, commodity price surprises following OPEC announcements, or specific global prices that differentiate between supply and demand. The goal isn't to turn every department into a research unit; it's to ensure that major decisions are based on actionable insights, particularly in real-time. Method note: IV local projections are often easier to explain than complete structural models and can be updated as new data comes in without needing to retrain everything.
Finally, we must rethink incentives and educational structures. For educators, the focus should be on teaching "revision-aware" literacy. Students need to learn to interpret a data release along with its revision history, calculate simple revision-risk metrics, and create dashboards that show ranges for vintage data instead of a single figure. Administrators should implement "cooling-off" periods for decisions based on notoriously unpredictable indicators and insist on disclosing the error distributions of forecasts and the performance of models over time. Central banks and finance ministries can start publishing "revision cones" with each significant release—confidence bands that reflect historical restatement patterns—so the public understands that a figure is a preliminary draft, not a final answer. Tactically, we can apply half-life weights to nowcasts so that new data points are accounted for without overwhelming the past. Strategically, we can evaluate teams based on how well their decisions hold up after revisions, rather than how quickly they act on the initial data.
Critics may argue that the world moves too fast for any of this—that waiting even a month could mean missing a critical shift. This is a false choice. The alternative to impulsive policy isn't paralysis; it's structured patience. Cooling-off periods can be short and dependent on conditions—typically 48 hours when revision risk is high, and immediate action when it's low. Replay-style sampling does not slow down decision-making; it changes what information you consider at the table. IV identification doesn't require a year-long study; it means that when causality is essential, we choose credible approaches based on the time available. Others might caution that relying on older data can be risky during a regime shift. That's why we adjust our focus rather than freeze: half-lives allow new information to gain importance as it proves reliable across a few releases. The common theme is a commitment to humility. When we make it part of the process, it becomes a habit rather than a hope.
The educational implications are immediate. Teaching decision-makers to "think in vintages" brings a calmer approach to governance. Case studies can guide students through payroll revisions, asking them to suggest policies before and after the updates and to analyze how different weighting methods would have influenced their decisions. Capstone projects can integrate an RL-style replay sampler with a real-time macro dashboard, giving future officials practice in combining past and present data. Communication courses can train leaders to clearly state, "Here is our uncertainty budget and our revision plan," which builds trust when inevitable changes occur.
The administrative implications are also practical. Procurement departments could require vendors to display out-of-sample and out-of-vintage performance for forecasting tools. Economic briefings can be redesigned so front pages show revision cones and identification notes, rather than just summary figures. Audit offices can evaluate agencies based on how healthy policy decisions perform after data revisions. These are not extravagant additions. They are simple design choices that, collectively, shift the focus from chasing immediate data to understanding the broader picture.
The policy implications relate to credibility. When a central bank or ministry demonstrates to the public how it weighed new information against the revision record, it encourages scrutiny of the process rather than the individuals involved. That is how institutions gain the ability to operate in uncertain environments. It's also how they avoid the gradual loss of public trust that follows significant mistakes.
We should conclude where we started: with the notable fact that hundreds of thousands of "jobs" can disappear in a revision cycle and that changes in methodology can reshape a country's growth narrative. These swings will continue; data are constantly evolving. What we can change is our response. Suppose we continue to treat the latest figures as the most accurate approximation. In that case, we will likely overreact—tightening too late, loosening too early, and overspending in some areas while under-spending in others. If we build replay into our workflows, demand causal identification for claims, and teach revision-aware literacy as a core skill, we can maintain the pace of real-time work without the backlash. The call to action is straightforward: don't slow down—stabilize. Insert a replay buffer between the intensity of the data and the hand on the policy lever, and measure success by how healthy decisions endure as the data change, as they inevitably will.
The views expressed in this article are those of the author(s) and do not necessarily reflect the official position of the Swiss Institute of Artificial Intelligence (SIAI) or its affiliates.
References
Angrist, J. D., & Pischke, J.-S. (2009). Mostly harmless econometrics: An empiricist's companion. Princeton University Press.
Bank of England. (2024). Forecasting for monetary policy making and communication at the Bank of England: A review (Bernanke Review). Retrieved April 12, 2024.
Bureau of Economic Analysis (BEA). (2024–2025). GDP revision information. US Department of Commerce.
Bureau of Labor Statistics (BLS). (2025, September 9). Preliminary benchmark revisions for CES estimates. US Department of Labor.
Cleveland Fed. (2024). Inflation nowcasting. Federal Reserve Bank of Cleveland.
Conrad, C., & Enders, Z. (2024). The limits of the ECB's inflation projections (SUERF Policy Brief No. 945). SUERF.
Giannone, D., & Primiceri, G. (2024, September 19). The drivers of post-pandemic inflation. VoxEU.
International Monetary Fund. (2024). Enhanced inflation forecasts with machine learning (Working Paper WP/24/206).
Mnih, V., et al. (2015). Human-level control through deep reinforcement learning. Nature, 518, 529–533.
Office for Budget Responsibility (OBR). (2024, October 31). Blue Book 2024 revisions.
Office for National Statistics (ONS). (2024). GDP revisions in Blue Book 2024. UK Government.
Reuters. (2025, February 7). US job growth through March revised down by 598,000.
Reuters. (2025, August 19). UK economy was a bit bigger than thought at end of 2023, ONS says.
Schaul, T., Quan, J., Antonoglou, I., & Silver, D. (2016). Prioritized experience replay. International Conference on Learning Representations. (arXiv:1511.05952).
European Central Bank. (2023). An updated assessment of short-term inflation projections by Eurosystem staff. Economic Bulletin box.
Arnold, M., et al. (2023). Dealing with information overload: A comprehensive review. Frontiers in Psychology, 14.
Ahmed, S., et al. (2023). Examining the association between social media fatigue and misinformation. Scientific Reports, 13.
(Additional background sources consulted include BEA GDP/GDI releases in 2024–2025 and Eurostat quarterly GDP updates for 2024–2025.)