Constant Inequality? Europe’s Welfare State Versus Coercive Equality
Input
Modified
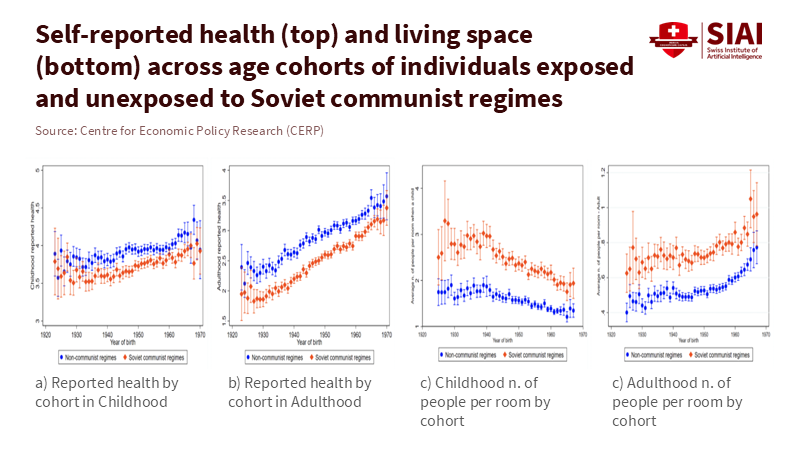
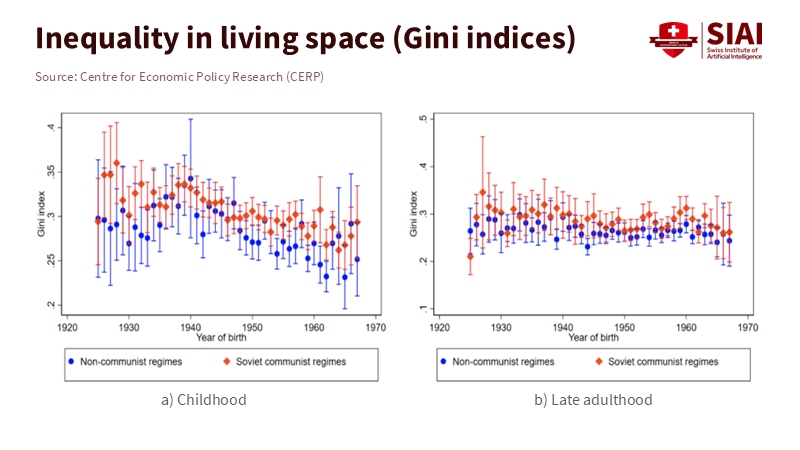
Communism did not reduce inequality more than other regimes and lowered overall welfare
Europe’s welfare capitalism cuts disposable-income gaps through taxes, transfers, and strong delivery systems
Tie school funding, time, and data to disadvantage to shrink learning gaps fast

The most stubborn number in European politics is not a deficit or an unemployment rate. It is the Gini coefficient, a measure of income inequality that remains relatively unchanged, even when governments do. In 2023, the EU’s Gini coefficient for disposable income stood at 29.6, which is lower than in the United States but higher than in the Nordic countries. Notably, it remained remarkably stable despite energy shocks and tight budgets. Examining the broader picture reveals the same trend: in 2024, the top 10% of earners in Europe earned approximately 36% of the income, compared to roughly 45% in the United States. These are not insignificant gaps. They stem from the system of taxes and transfers, rather than from eliminating markets or central planning. New research explains why: when we measure welfare beyond just cash incomes—taking into account housing space, health, and access to goods—we find that Soviet-style communism did not reduce inequality more than other regimes, and it left average well-being lower. The lesson is clear for education policy. Welfare capitalism reduces inequality where it really matters: for the child, in the classroom, and in families' monthly expenses.
What the newest evidence actually says
As informed citizens, your understanding of inequality is crucial. We often treat inequality like a scoreboard where one ideology wins or loses. That is the wrong way to think about it. The latest research compares Eastern European populations exposed to Soviet communism with those that were not, using comparable welfare metrics that extend beyond wages, including living space per person, self-reported health, and measures of deprivation. Across these measures, inequality did not disappear under planning; it reappeared through rationing, administrative privilege, and insider access, while average welfare was lower. A nuanced result shows that some indicators of social mobility look higher in communist settings. Still, this mobility was built on a lower level of material well-being. In other words, the overall level fell, even if some gaps narrowed. A related VoxEU column and LSE briefing provide clear explanations of the methods. When we harmonize welfare indicators across regimes and time, we find no better performance in equality under Soviet communism compared to mixed-economy democracies.
Method notes matter for policy. The numbers citizens debate are usually post-tax, post-transfer, adjusted household incomes. That is why Europe appears more equal than the U.S. after redistribution, even when market incomes diverge. The OECD’s microdata show that taxes and cash transfers reduce the market-income Gini by just over 25% on average across member states, with significant differences between countries. This reduction is shaped by policy, not fate. It involves the ongoing work of social insurance agencies, tax authorities, and data-linked eligibility systems. This also explains why sweeping claims about communism “eliminating major sources of inequality” are misleading without context: redistribution by effective welfare states compresses disposable incomes while maintaining incentives; coercive leveling, on the other hand, compresses everything, including innovation and access.

Europe’s inequality profile is also influenced by who is protected. In 2024, 21% of EU residents—approximately 93.3 million people—were at risk of poverty or social exclusion (AROPE), a slight decrease from 2023. The decline was small, but it occurred amid inflation and energy volatility. The stabilizer was not ideology; it was cash. Countries that paid benefits on time and scaled support automatically helped households before hardship affected schools. This is the quiet story behind Europe’s comparative strength: administrative capacity and budgetary commitment.
Welfare capitalism, not central planning, moves the needle for classrooms
If inequality seems “constant,” it is because we measure it where policy changes slowly. Disposable income does not change overnight. But the channels through which inequality impacts learning can shift quickly when the welfare state is effective. PISA 2022 offers a clear cross-country comparison. On average across the OECD, a student’s socio-economic status accounts for approximately 15% of the differences in mathematics performance. That link is not fixed. Some systems lower it to single digits; others exceed 20%. The difference isn’t due to magical teaching methods. It is about access to early childhood education, targeted funding, teacher allocation, and—notably—income and housing stability for the child. When social protection prevents families from falling far below median living standards, schools can maintain high expectations, assign experienced teachers to challenging classrooms, and manage learning loss through additional time and tutoring. This is welfare capitalism in action: growth-friendly markets, along with a framework of redistribution that promotes educational equity. This progress is not just theoretical; it is achievable and within our reach.

The required spending is significant. Europe’s leaders have chosen to embed it in their budgets. In 2024, public social expenditure generally approached or exceeded 30% of GDP in countries like France, Austria, and Finland. France, at the high end—around 30% of GDP—reflects this reality in its budget politics. Critics see this as fiscal complacency. However, the key factor for education is not just the overall ratio; it is how funds are delivered: automatic child allowances distributed monthly, housing supports that prevent forced relocations during the school year, and tax credits that lower work costs for parents. Where these supports are robust, disposable income inequality is lower, and its impact on classrooms is less severe. Your understanding of this European model is crucial, as it outperforms central planning in promoting equity without stifling innovation.
A second component is the design of supports. The East-West divide within the EU is often attributed to “bureaucratic shortcomings.” This term masks many issues. In some countries, low benefit uptake is due to complicated forms or inconsistent digital identification. In others, rules exclude informal workers or recent migrants. The outcome is reflected in AROPE rates and the experiences of schools serving mobile or newly low-income families. Eurostat’s 2024–2025 data indicate that youth and children continue to face higher risks than the average population. Where registries are modern and onboarding is streamlined, coverage increases, and school attendance stabilizes. This is the kind of state capability that communist regimes claimed to have but rarely delivered, where it mattered—at the household level that supports ongoing student learning.
What education systems should do next—design for constant fairness
The policy goal should not be to chase a single Gini number. Instead, we need to shorten the time between household crises and school responses. This can be done without new ideologies. First, funding formulas should significantly weigh the disadvantage to influence staffing. Suppose the socio-economic gradient in PISA accounts for 15% of the variance in performance. In that case, the funding gradient should be designed to more than offset that tilt, rather than simply acknowledging it. Second, time is the most straightforward equity lever. Tutoring that follows the student—movable across grades and schools—outperforms school-level grants that get lost in general spending. Third, we should connect education data and social protection data through legal, privacy-respecting channels. When a housing subsidy ends or a benefit is delayed, schools should have enough information to provide support within weeks, not months. These are administrative improvements, not far-fetched ideas. They can expand because they utilize the same welfare systems that already reduce disposable-income inequality.
Likely critiques deserve a direct response. One argument claims that the “constant inequality” we see shows that policy does not matter. The evidence suggests otherwise. OECD microdata and updates from Our World in Data indicate that taxes and transfers consistently reduce market-income inequality by significant percentages in Europe. The constant inequality observed is the result of persistent counter-pressures—like technology, globalization, and demographic changes—balanced by constant stabilizers. Another argument maintains that communism, at the very least, eliminated extremes. The cross-regime research responds: when measured narrowly through wages, you might see some equality; when measured by actual access to goods and services, inequality persisted, and welfare declined. A third argument asserts that Europe achieves equality at the expense of lost dynamism. The most credible interpretation is more nuanced: poorly designed redistribution harms growth; well-designed redistribution builds resilience and enhances long-term human capital. Classrooms are where these benefits are realized.
We should also be cautious about measurement traps. Inequality can shift within households (due to gender dynamics), across life cycles (between pensions and wages), and between regions. Disposable income is a helpful measure, but non-cash benefits—especially health—often reduce effective inequality more than cash figures suggest in some systems. The OECD documents these effects and warns that definitions are crucial when comparing countries and decades. The policy implication is not to pursue a perfect metric; we should create dashboards that blend income, material deprivation, and learning outcomes at detailed geographic levels. That is how ministries can identify where welfare systems leak into schools.
Toward a constant of fairness, not a constant Gini
If there is a constant in Europe, it is not inequality—it is capacity. Capacity to tax. Capacity to pay. Capacity to deliver benefits that arrive before eviction notices. New research on exposure to Soviet-era policies concludes a long-standing debate: coercive equality did not surpass mixed-economy welfare states in reducing inequality when accounting for real welfare, and it imposed significant costs on living standards. Europe’s advantage lies in automatic stabilizers that keep households near the center of the economy. At the same time, schools engage in the slow, yet steady, work of building skills. This is the model we should invest in now.
The call to action is clear. Keep markets open and innovative; strengthen redistribution where it protects learning. Maintain cash benefits for families with children during consolidation cycles. Simplify eligibility to make it digital and portable. Align teacher allocation and tutoring with actual needs, rather than relying on historical averages. Publish an annual learning-gap report that measures the difference between the bottom quartile and the median by municipality, along with the AROPE rate, so that education and social ministries can share goals. Most importantly, success should be measured by how quickly systems assist struggling households before a student’s attendance drops and achievement gaps widen. If we accomplish this, the most stubborn number in European life will finally start to change where it matters—in classrooms—year after year. This is the promise of welfare capitalism, and it is the lasting solution to the misconception that only ideology can create equality.
The views expressed in this article are those of the author(s) and do not necessarily reflect the official position of the Swiss Institute of Artificial Intelligence (SIAI) or its affiliates.
References
European Commission (Eurostat). (2025). People at risk of poverty or social exclusion in 2024 (EU-SILC AROPE release, 30 April 2025). https://ec.europa.eu/eurostat. (21.0% AROPE; 93.3 million people).
European Commission (Eurostat). (2025). Living conditions in Europe—Income distribution and income inequality (updated 2025). https://ec.europa.eu/eurostat. (EU Gini 29.6 in 2023).
LSE EUROPP. (2025, September 9). Soviet communism was no more successful at reducing inequality than other regimes.
OECD. (2023). PISA 2022 Results (Volume I): The State of Learning and Equity in Education. Paris: OECD Publishing. (Socio-economic status explains ~15% of variance in maths). https://doi.org/10.1787/53f23881-en.
OECD. (2024). Society at a Glance 2024—Social spending. Paris: OECD Publishing. (Public social spending near/above 30% of GDP in several countries; France ≈30%).
OECD. (2024). Addressing Inequality in Budgeting. Paris: OECD Publishing. (Budget tools and evidence on taxes/transfers reducing inequality).
OECD. (2025). Income redistribution across OECD countries (updated brief). Paris: OECD Publishing. (Taxes and transfers reduce market-income Gini by >25% on average).
Our World in Data. (2025). Reduction in income inequality before and after tax (OECD, 1976–2023) (updated 16 April 2025). https://ourworldindata.org.
WID—World Inequality Database. (2024, November 19). Inequality in 2024: A closer look at six regions. (Europe's top 10% share ≈36%; the U.S. ≈45%). https://wid.world/.
Costa-i-Font, J., Nicińska, A., & Rosselló Roig, M. (2025). Soviet communism was no more successful at reducing inequality than other regimes. VoxEU (24 September 2025). https://voxeu.org.
Costa-i-Font, J., Nicińska, A., & Rosselló Roig, M. (2025). The Effects on Inequality and Mobility of Exposure to Soviet Communism (Communist and Post-Communist Studies / CESifo Working Paper 11916).


Comment