Market-Based Inflation Predictor: How Education Can Budget Smarter with Markets and News

Ethan McGowan is a Professor of AI/Finance and Legal Analytics at the Gordon School of Business, SIAI. Originally from the United Kingdom, he works at the frontier of AI applications in financial regulation and institutional strategy, advising on governance and legal frameworks for next-generation investment vehicles. McGowan plays a key role in SIAI’s expansion into global finance hubs, including oversight of the institute’s initiatives in the Middle East and its emerging hedge fund operations.
Input
Modified
Markets provide the fastest, most reliable signal of expected inflation
Pairing market prices with news-based textual indicators improves shock classification and timing
Education systems should anchor wages and procurement to this dashboard with simple, rules-based triggers

The most reliable real-time indicator of where prices are heading is right in front of us. On 12 November 2025, the US five-year, five-year forward rate, which gauges average inflation five to ten years from now, was 2.17%. This is not a model created in a lab. It reflects what professional investors are willing to pay today to hedge against inflation risks tomorrow. It updates daily, adjusts to new information within minutes, and has no agenda. As a market-based inflation predictor, it shows that long-term price growth is near 2%. The five-year breakeven rate stands around 2.37%, signaling near-term pressure. In Europe, inflation-linked swap rates have stayed close to target since 2024. Another critical point is the FAO’s global food price index, which is 21% below its March 2022 peak. Both markets and food prices indicate that while disinflation is real, it is also fragile. For educational institutions and ministries, this information is crucial for decision-making.
Empowering Education Leaders with a Market-Based Inflation Predictor
Education leaders often deal with long budget cycles alongside fluctuating input costs. Payroll adjustments, meal programs, transport contracts, digital services, and construction all depend on price trends. However, official data often reports these trends with delays. A market-based inflation predictor bridges that gap. It does not replace statistics offices but complements them by converting live trading prices into a reliable signal. When bond markets set inflation at 2–2.5% and food commodity prices ease, procurement can move from building worst-case buffers to using risk-based ranges. When market conditions change, plans should adjust accordingly. The benefits are clear: fewer unexpected reallocations, less pressure to renegotiate wage or vendor agreements mid-year, and more credibility when presenting financial plans to boards or parliaments. The goal is not to idolize markets; it is to use the best available measure. This measure is updated daily and reacts quickly to new shocks.
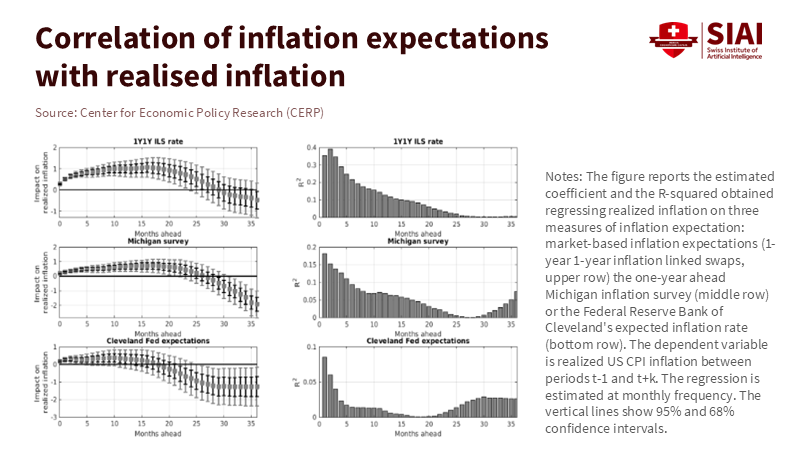
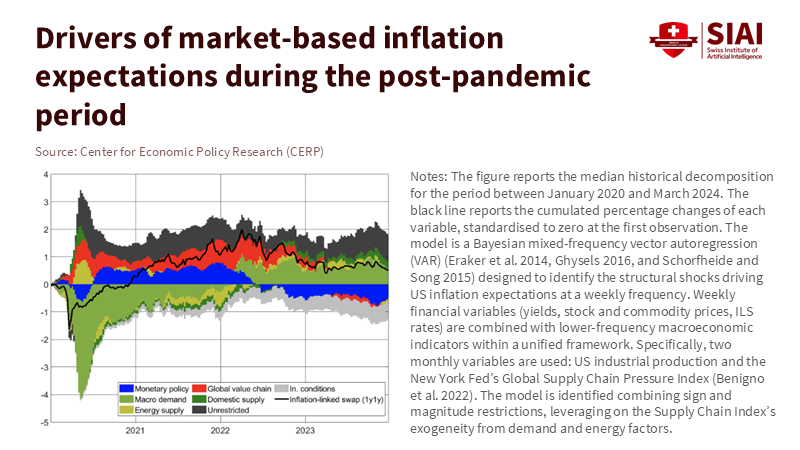
Recent research supports this approach. High-frequency market prices can break down to reveal the factors driving inflation risk, such as energy prices, supply chains, domestic bottlenecks, demand, or policy. This analysis is essential because energy spikes often reduce over time, while global supply chain challenges can persist and impact overall costs. When the cause is persistent, education systems require longer hedges and staggered contracts; when it is temporary, they need patience and cash reserves. A new market-based framework identifies these drivers in near real time and connects them to potential inflation paths. It is the most significant practical improvement to traditional dashboards we’ve seen in years.
Add news to the market-based inflation predictor
While markets act quickly, they do not always have all the context. This is where news-based indicators enhance performance. Recent studies show that analyzing commodity-related news—such as stories on supply disruptions, logistics, and demand—can reduce inflation forecast errors by 20–30% compared to standard models. This makes sense because news provides detailed information about shocks before the data can catch up, such as a port strike, a drought forecast, a subsidy change, or a pipeline repair. These details affect the likelihood of persistence. Textual signals complement the market-based inflation predictor by indicating whether traders are responding to temporary noise or to a more serious constraint that will affect costs such as cafeteria food and bus fuel months later. The outcome is a more stable read: markets offer the consensus price, while text adds details on the cause. Both should be used.
This combination is vital now, as overall disinflation hides underlying challenges. In October, global food commodity prices fell to 126.4 on the FAO index, marking the second consecutive monthly decline. Yet, metal prices critical for data center construction have remained steady this year. Oil prices are influenced by geopolitics, while gas and freight costs have declined. The overall picture is not “back to 2” everywhere; it is “mostly 2, with some areas of concern.” Text signals can highlight those areas early. Markets then convert the combined information into a single, continuously updated number. Together, they provide education finance teams with insights that official reports may not offer: a forward-looking, continuously updated baseline with identified risks.
What a market-based inflation predictor means for education budgets
The first takeaway is about setting wages. Wages are the largest budget item, and salary reviews often rely on past CPI numbers. Suppose the market-based inflation predictor is around 2%. In that case, boards can agree on forward-looking settlements that align with expected inflation rather than last year’s surge. This lowers the risk of real wage declines if inflation unexpectedly rises and prevents overshooting if it falls. It also supports the broader goal of maintaining purchasing power without triggering a wage-price spiral. In practice, establish a range for cost-of-living adjustments that refers to both market indicators and the latest inflation figures. Update this quarterly instead of annually. This approach softens shocks for staff and stabilizes multi-year plans. At the same time, use textual indicators to identify sectors where prices may persist, such as catering, transport, and learning materials, and prepare contingencies.
Secondly, procurement can shift from fixed-date contracts to event-triggered execution contracts. For instance, if the five-year breakeven drops by 30–50 basis points and FAO food prices decline for two months, that suggests negotiating shorter-term food contracts or potentially implementing indexed menus with price caps. If energy-linked markets signal a lasting risk, extend the hedge window for bus fuel or heating, or include options to revisit contracts tied to market indices rather than relying on headline CPI. These strategies do not require complex financial instruments on the education budget. They need contract terms that reference public benchmarks and allow narrow adjustments when those benchmarks change. The public adapts to this method with electricity; there is no reason that school systems cannot apply it to transport or food services. Recent evidence from Europe shows that market rates have remained stable near target since 2024, making it easier to anchor these clauses and reducing the chances of disputes.
Limits, risks, and how to use the market-based inflation predictor safely
Three critiques should be addressed. First, “markets are noisy.” This is true. Market-based metrics, such as the risk premium, may be affected by changes in liquidity. However, the price discovery process in European inflation-linked swaps appears robust, with greater activity during significant price changes and broader participation from informed investors. This pattern improves signal quality rather than diminishing it. Additionally, the stability of euro-area inflation-linked rates near target since 2024 indicates that the market has moved past the technical distortions of the 2021–2023 spike. While noise still exists, the directional information becomes harder to ignore.
Second, “markets are self-fulfilling.” Could acting on a market-based inflation predictor actually influence inflation? Expectations can indeed change behavior. However, the more realistic risk here is not that school districts will move markets, but that we might overreact to a single reading. The solution is governance rather than avoidance: establish decision rules that utilize moving averages and require confirmation from news signals. Avoid reacting to daily fluctuations. Wait for a two- to three-week persistence before adjusting cost-of-living adjustment ranges or contract triggers. This maintains the benefit of timely information without turning budgeting into speculative trading. It also alleviates concerns that citing market trends in public comments could unintentionally drive up inflation. A calm process is better than impulsive reactions.
Third, “statistics offices already provide everything we need.” They inform us of the past but may not always indicate what is changing. For example, consider global food prices in October: they dropped but remained well below the 2022 peak. This information is helpful for meal planning, while forward-looking inflation indicators are close to central bank targets. When these signals align, confidence in the baseline strengthens. When they diverge, combining market data with textual insights helps pinpoint where we need more contingency. This is preferable to waiting a quarter to realize that a supply shock has affected overall costs.
Building the operating playbook around a market-based inflation predictor
Place the predictor at the core of a straightforward monthly routine. Begin with the five-year breakeven and the five-year forward rate. If the gap between them increases, it indicates that near-term pressure is rising faster than the long-term anchor. If it narrows, near-term pressures are easing. Include the FAO food price index and oil prices—not because they always influence the budget, but because food services and transport are significant budget items. Lastly, scan for text signals about supply disruptions and policy changes that affect your inputs. This three-part process—markets, key commodities, and news—should fit on one page and take one hour each month. Connect this process to pre-agreed actions: adjust reserves, reconsider tender timelines, or revisit contract clauses. Document the process so decisions appear systematic and not arbitrary when auditors or the public review them.
The research backing this playbook is strengthening. A market-first strategy can clarify which factors affect expected inflation in real time. These factors behave differently. Energy supply spikes usually occur quickly and are temporary, underscoring the need for short-term buffers rather than long-term commitments. Domestic supply constraints that raise core costs require careful planning for staffing and budget growth. Global disruptions necessitate broader risk management and longer lead times for acquiring materials and technology. Analyzing text improves the chances of quickly classifying each factor. This can mean the difference between waiting for CPI reports and proactively positioning procurement. It can also distinguish between a budget that withstands a shock and one that could break.
We do not need to predict future prices in the abstract. The market-based inflation predictor summarizes what informed investors believe and are willing to back with their money. This week, that signal in the United States indicates long-term inflation is about 2.17%. In comparison, short-term pricing is slightly higher at around 2.37%. Market indicators in Europe have remained close to target for over a year. Global food prices have fallen significantly from their 2022 peak. None of this guarantees a smooth journey. However, it offers education leaders a rational foundation and a method to adjust when that foundation shifts. The call to action is clear: implement a monthly dashboard that combines market and news inputs; include triggers in contracts; align wage adjustments with forward-looking measures; and create small, rules-based buffers that use text signals to identify persistence. This is not a gamble on markets; it is a commitment to being prepared for the next challenge.
The views expressed in this article are those of the author(s) and do not necessarily reflect the official position of the Swiss Institute of Artificial Intelligence (SIAI) or its affiliates.
References
Bank for International Settlements. (2025). BIS Quarterly Review: September 2025. Basel: BIS.
Cassinis, M. G., Ferrari Minesso, M., & Van Robays, I. (2025, November 12). Supply shocks and inflation: Timely insights from financial markets. VoxEU/CEPR.
European Central Bank. (2025, July). Activity and price discovery in euro area inflation-linked swap markets. ECB Economic Bulletin (Issue 5).
European Central Bank. (2025). Working Paper Series No. 3096: Supply shocks and inflation: timely insights from financial markets. Frankfurt: ECB.
Food and Agriculture Organization of the United Nations. (2025, November). FAO Food Price Index declines in October; world cereal stocks set to reach record high. Rome: FAO.
International Monetary Fund. (2025, April). World Economic Outlook—Commodity Special Feature. Washington, DC: IMF.
Malliaropulos, D., & Passari, E. (2025, September 20). Understanding inflation with textual analysis: How news about commodities improves predictions. VoxEU/CEPR.
Federal Reserve Bank of St. Louis. (2025). 5-Year, 5-Year Forward Inflation Expectation Rate (T5YIFR). St. Louis, MO: FRED.
Federal Reserve Bank of St. Louis. (2025). 5-Year Breakeven Inflation Rate (T5YIE). St. Louis, MO: FRED.
Ethan McGowan is a Professor of AI/Finance and Legal Analytics at the Gordon School of Business, SIAI. Originally from the United Kingdom, he works at the frontier of AI applications in financial regulation and institutional strategy, advising on governance and legal frameworks for next-generation investment vehicles. McGowan plays a key role in SIAI’s expansion into global finance hubs, including oversight of the institute’s initiatives in the Middle East and its emerging hedge fund operations.