AI-Driven Labor Displacement and the Widening Gap Between Nations

Publications under SIAI Editor are prepared or coordinated by SIAI’s research and editorial team and include research synthesis, policy and industry analysis, technical interpretation, and interdisciplinary work connecting artificial intelligence with established fields of research and professional practice.
Authored on
Modified
AI automation may weaken employment and traditional wage advantages
Research talent and institutions will shape national outcomes
Tax erosion could constrain support for displaced workers

Around 3.3 million workers in the U.S. lost jobs that they had held for 3 years or more between 2023 and 2025. The BLS reported that 66.1% were reemployed as of January 2026, 18.3% were unemployed and 15.7% were out of the workforce. Only 49% of the full-time reemployed workers earned the same as or more than before; that was 62% two years ago. These numbers are concerning for a labor market that has seen little to no AI labor displacement. This is what it costs people to be unemployed and it's what most labor transition plans will assume will happen. There is a possibility that the market can absorb AI displacement through retraining and that may be the case. But if it's not, people will suffer first and governments will have to step in. Fewer workers means less tax revenue, which will limit the ability to help those who lost jobs.
Why AI Job Displacement May Outpace Job Creation
Economists have shown that the U.S. has more jobs today than it did in 1940. Most jobs didn't even exist back then. However, the same research has also shown that automation has decreased demand more than it has increased it over the last 40 years. With the rise of AI, there has been a concentration of jobs being created at the upper income level. Some have also been created at the lower levels of the wage spectrum. The OECD Employment Outlook for 2026 shows that when jobs are lost due to technology or global trade, workers end up unemployed. New workers are hired to fill those jobs and these trends continue.
If a worker can produce 5x more at a lower unit cost, demand would need to increase fivefold for employment to stay the same. James Bessen has shown this to be true in the US. Demand for textiles, steel and automobiles was high enough to create jobs until it wasn't. Software and professional services have shown high demand elasticity for the last 30 years. According to Nasscom, revenues in the Indian IT industry will increase by 6.1% to reach $315B in FY26. Employment is projected to grow by 2.3%. An ICRIER survey showed that 65% of companies are hiring fewer employees and 55% are not hiring at entry levels. But 82% of companies reported no change in hiring for senior positions. This shows that revenue and jobs in the industry have started to decouple.
Research on labor displacement is inconclusive. The IMF has estimated that 40% of jobs are exposed to AI and 60% in developed countries. A study from the Stanford Digital Economy Lab showed that employment for 22- 25-year-olds in exposed jobs was 19% lower than their peers in non-exposed jobs. This was due to less hiring of new workers. Another study showed a decrease in employment for coders after the introduction of ChatGPT. Humlum & Vestergaard found no change in wages or hours worked for Danish workers exposed to AI. Fairlie and Wu showed no increase in unemployment for U.S. college graduates. All of these studies measure different aspects of unemployment and hiring. There can be displacement of jobs that are never hired for, which will not show up in these metrics.
Robots Will Reduce the Advantage of Low Wages
There are currently 5 million industrial robots in use around the world. Most of them are still used in contained work cells. There have been some humanoid robots used in testing. A figure shows two robots at BMW Spartanburg that have logged 1250 hours and placed 90,000+ parts over 11 months. Hyundai will be using the Atlas robot at their plant in Georgia by 2028. They also plan to manufacture 30k robots per year. Versatile robots could become commercially viable between 2028 and 2032.
It all depends on wages. It will cost about the same amount to buy a robot in Germany or Vietnam. The cost of labor will be around $50/hr in Germany and $2/hr in Vietnam, assuming a cost of $150k installed in 2026, decreasing by 1/3 every 5 years. The model also assumes the robot will be able to operate for 3000 hours per year in 2026 and increase by 1000 hours every 5 years. Then robots will become cheaper than labor at wages of $78/hr in 2026. $11/hr in 2029, $6/hr in 2032 and $3.80 in 2036. This means that Germany, the Netherlands, Sweden, the US, Japan, the Czech Republic and Poland will be able to automate by 2029. Mexico in 2033 and China in 2034. Malaysia, Thailand, Indonesia, India and Vietnam will not see robots cheaper than labor until after 2040.
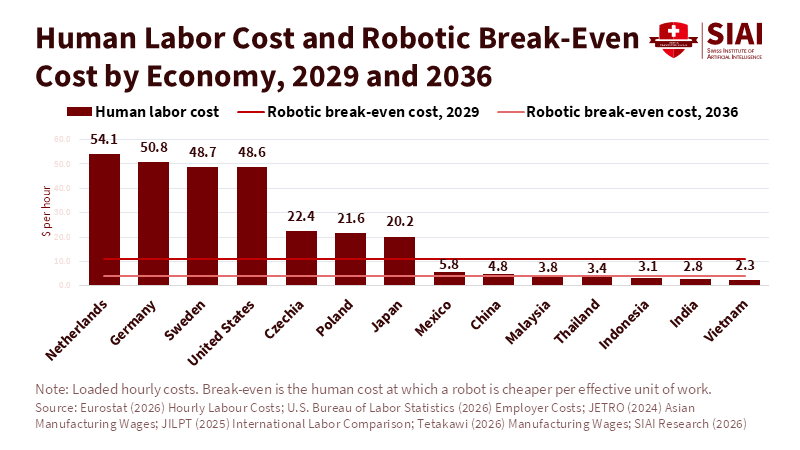
Robots don't need to be cheaper than Labor to be useful. If 80% of labor is replaced with robots, the cost of labor in Germany will drop from $51/hr to $15/hr. U.S. labor will drop from $48.60/hr to $14/hr. China will see a drop of less than $1/hr and Vietnam will see no change. The Germany-to-Vietnam wage ratio will go from about 22:1 to 6.5:1. If 95% of jobs are automated, that ratio will be 3.5:1. Low wages will still be beneficial, but by at least 2/3's less. China added 354,000 robots in 2025, which was 59% of all robots installed in the world. Europe only installed 11% fewer robots than it did the year before. However, these are all conventional robots. Germany had 449 robots per 10,000 manufacturing workers in 2024 and China had 166. Faber has shown that robots decreased employment and exports in Mexico. Mainly, workers with lower education levels who worked with machines.
AI Skills and Research Will Shape National Competitiveness
Countries will need to focus on producing workers who can do research and use and verify information produced by machines. It will take time to build a skilled workforce that can do this. By the time it's 2036, those workers will already be in school. National education indicators from before ChatGPT offer a guide. PISA 2022 math scores provide a rough estimate. Singapore scored 575, Japan 536, Korea 527, Germany 475 and the U.S. scored 465. The OECD average was 472 and Mexico scored 395. Korea spends 4.94% of GDP on research and development and has 9472 researchers per million people. China spends 2.58% of GDP and has 2107 researchers per million, which is less than half of the US.
Technology can be imported, but skilled workers are still needed to improve it. Research has shown that countries that have higher levels of human capital see higher benefits from AI. A paper by Hao, Xu, Li and Evans analyzed 41.3M papers in the natural sciences. They found that those using AI produced 3.02x more papers, got 4.84x more citations and completed their research 1.37 years earlier. The topics of the papers were also 4.63% less diverse. This could be due to selection bias, but it seems that AI will help those who already know what they are doing.
There needs to be a place for these workers to work. Europe has about 150B in venture capital compared to the U.S. 930B. Almost 30% of European Unicorn companies have moved to the U.S. between 2008 and 2021. Workers will follow the labs and investors. After 1933, Jewish German chemists moved to the U.S. and increased patenting in the U.S. by 31%+ in their fields. It's hard to measure this with growth numbers. There is no correlation between institutional quality in 2005 and growth in R&D in up to 109 countries. But there is a correlation between institutional quality and IP income. Perhaps countries with better institutions will attract more companies and workers and see more benefits from AI. The outcome remains uncertain.
Table 1. Human Capital, Research and Institutional Capacity by Economy
| Economy | R&D (% GDP) | Researchers per million | PISA Math | Gov. Effectiveness |
|---|---|---|---|---|
| United States | 3.45 | 4,937 | 465 | 1.29 |
| Germany | 3.15 | 5,926 | 475 | 1.57 |
| Japan | 3.44 | 5,609 | 536 | 2.03 |
| South Korea | 4.94 | 9,472 | 527 | 1.49 |
| Singapore | 1.81 | 8,782 | 575 | 2.10 |
| China | 2.58 | 2,107 | n.a. | 0.61 |
| India | 0.65 | 259 | n.a. | 0.51 |
| Vietnam | 0.41 | 836 | 469 | -0.19 |
| Mexico | 0.25 | 438 | 395 | -0.11 |
Note: The latest available observations are from 2018; PISA scores refer to 2022. Government effectiveness is a World Bank governance indicator, with higher scores indicating stronger performance. n.a. = not available.
AI Job Losses Could Weaken Tax Revenue
Workers make up the majority of tax revenue in most countries. The OECD states that taxes on labor are 64.8% of revenue in Germany and 63.5% in the U.S.. Mexico only collects 34.6% from labor. If productivity increases by 100, tax collections would be about 16. If 40 of those 100 go to a foreign AI company, tax collections would fall to 8. If the number of workers falls by 80% and wages increase by 200%, payroll tax collections fall by 40%, but income tax collections fall by only 15%. If one of those two workers moves abroad, tax collections fall by 57.5%. Research has shown that some workers will move if taxed at a high rate. Depending on the type of work they do. But this should not be used to argue against taxing high earners.
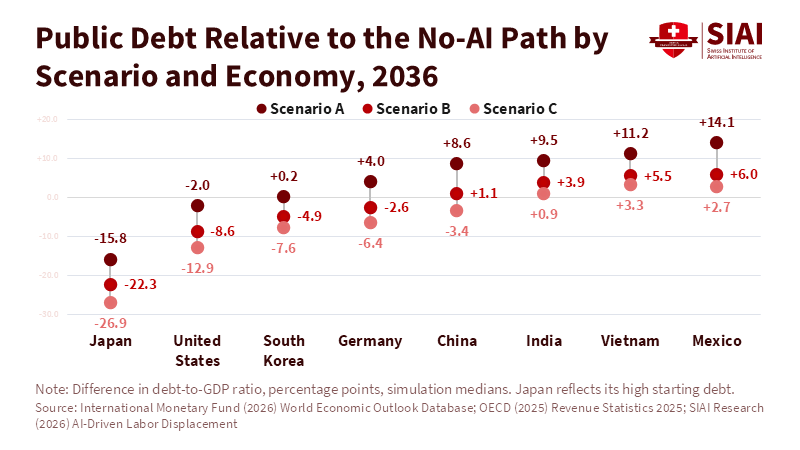
The scenario model projects taxes to 2036. Taxes as a percentage of GDP will decrease for all countries by .3 to 1.2%. Countries that are considered developed will still see an increase in taxes. If AI is adopted quickly and skills and institutions stay the same, taxes will increase by 5% to 8%. With improvements in skills and institutions, taxes will increase by 9% to 13%, assuming a 12% to 16% increase in productivity and 8% to 11% in GDP. Developing countries will see a decrease in taxes of 3% to 7% if AI is adopted quickly. Debt will increase in most countries. Mexico will see an increase of 14.1% of GDP in debt (median), with a range of 10.3 to 18.8. Vietnam will see an increase of 11.2% and India 9.5%. Germany will see an increase of 4.0% and the U.S. a slight decrease. These are based on assumptions and should not be taken as fact. The EU already spends 4.9 trillion on social protection, which is 27.3% of GDP.
Income Protection Must Reflect Reemployment Risks
In an October 2026 paper for Brookings, Robert Litan proposed wage insurance for workers involuntarily displaced after at least 3 years of employment, covering 80% of lost earnings in the first year after reemployment, 60% in the second and 40% in the third, alongside job training and a tax credit for companies hiring entry-level workers. This would cost about 38B, $ 11.5 B and 11B, respectively. Or about 60B per year if unemployment stays around 6%. There is research that has shown wage insurance can help increase employment in the short term and wages in the long term. This will help people if they are just unemployed due to a typical economic cycle.
But if there is a lower chance of finding a job, this benefit will not help people as much. If they don't find a job, this benefit will not help them at all. In the BLS example above 34% of workers are not employed. In the modeled scenarios, that number will be 48% in the U.S. and 64% in Mexico and Vietnam. The cost to support those who are not working will be .77% of GDP in the U.S. (median), with a range of .5 to 1.2%. This compares with .39% in the middle scenario and .23% with improved skills and institutions. The proposal above would cost about .2% of GDP. These are not directly comparable, but the labor and finance departments should know the difference. Reemployment rates, tax receipts from AI companies and the number of high earners in a country will determine which approach works best.
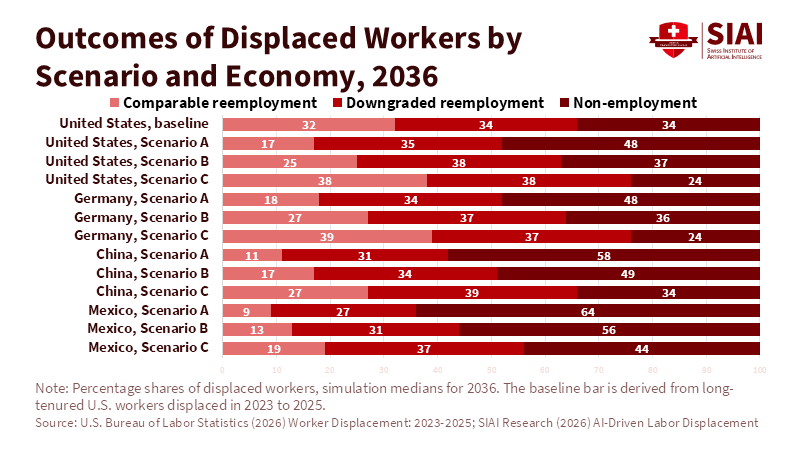
Among long-tenured displaced workers, about two-thirds found another job. Among those reemployed full-time, about half earned at least as much as before. That is in a labor market where most jobs are still filled by humans. In the fast-adoption scenario, close to 50% of displaced U.S. workers remain without jobs by 2036. Supporting those who are not working would cost .77% of GDP, almost 4x the amount proposed above. And the countries that will see the largest increases in debt are Mexico, Vietnam and India who have the lowest tax revenues to begin with. Future unemployment rates remain uncertain, but they will determine how much governments can spend on supporting displaced workers.
This article is based on an original research article published by The Economy Research. For the original version, please refer to AI-Driven Labor Displacement and National Economic Competitiveness.
This article reflects the analytical judgment of the author and does not constitute policy advice or the official position of any affiliated institution.
References
Bessen, J. (2019) ‘Automation and jobs: When technology boosts employment’, Economic Policy, 34(100), pp. 589–626.
Brynjolfsson, E., Chandar, B. and Chen, R. (2026) Canaries in the Coal Mine? Six Facts about the Recent Employment Effects of Artificial Intelligence. Stanford Digital Economy Lab.
Eurostat (2026) ‘EU social benefits expenditure up 5% in 2025’, Eurostat News, 6 November.
Figure AI (2025) ‘F.02 contributed to the production of 30,000 cars at BMW’, 19 November.
Hao, Q., Xu, F., Li, Y. and Evans, J. (2026) ‘Artificial intelligence tools expand scientists’ impact but contract science’s focus’, Nature, 649, pp. 1237–1243.
Indian Council for Research on International Economic Relations (2026) AI and Jobs: This Time Is No Different. New Delhi: ICRIER.
International Federation of Robotics (2026) ‘Five million robots now operate in factories globally’, 24 September.
Litan, R.E. (2026) ‘A detailed, affordable plan for transition insurance in the AI era’, Brookings Institution, 30 October.
Organisation for Economic Co-operation and Development (2026) OECD Employment Outlook 2026. Paris: OECD Publishing.
U.S. Bureau of Labor Statistics (2026) ‘Worker displacement: 2023–2025’, 27 August.
Publications under SIAI Editor are prepared or coordinated by SIAI’s research and editorial team and include research synthesis, policy and industry analysis, technical interpretation, and interdisciplinary work connecting artificial intelligence with established fields of research and professional practice.
Similar Post