AI-Driven Labor Displacement and National Economic Competitiveness
Published
Keith Lee*
*Swiss Institute of Artificial Intelligence, Chaltenbodenstrasse 26, 8834 Schindellegi, Schwyz, Switzerland

Chinese manufacturers supplied 60% of the over 20m electric vehicles sold globally in 2025. By August 2026, Chinese brands made up 11.7% of registrations in Europe. The conventional policy playbook of restructuring, lower costs and limited protection treats China’s cost advantage as the result of ordinary competition. The article argues that this has been accelerated by industrial policy over a period of more than a decade. Subsidies provided by the state have been calculated by CSIS to be worth $230.8bn over the period 2009 to 2023, which, through scale, learning by doing and proximity to suppliers, has created true efficiencies that can withstand fewer subsidies. Countervailing tariffs in 2024 target the subsidies but not the scale advantages. As seen by European supplier plants closing and the fall of Northvolt, this capacity may never return. The article recognises that protection will have an effect on consumers, decarbonisation and trade, as China’s tariffs on brandy, pork and dairy show. However, time-based protection that decreases over time if certain targets are met (that also apply to European companies) could give enough time to restructure, but that outcome is not certain.
1. Introduction
1.1 Why Workers Will Transition into Other Jobs
The general thought process is that workers will find other jobs. This can be backed by historical evidence. Autor, Chin, Salomons and Seegmiller found that most jobs currently available did not exist before 1940, using U.S. Census data from 1940-2018. There is some truth to this. The demand-reducing effect of automating innovation has grown over the past 40 years, while the demand-increasing effect of augmenting innovation has not. Jobs have grown in the high-paid professional fields and, to a lesser degree, in the low-paid job field since 1980.[1]
These examples show that in aggregate the labor market will adjust, but not every person who is displaced from their job can find another. The OECD recently came to this conclusion in its Employment Outlook for 2026. Workers who are displaced by technology and trade often transition to unemployment, those who are hired are usually new workers, and displaced workers suffer from long-term effects.[2]
1.2 Why Workers May Not Transition to Other Jobs
Machines can only do certain tasks in a factory setting. AI can do multiple tasks in multiple fields, which can cause multiple jobs to be taken away from workers in a variety of industries all at once. There is a chance that workers can no longer find work in any industry.
The IMF found in 2024 that about 40% of jobs worldwide are exposed to AI. The share is 60% in advanced countries, 40% in emerging countries and 26% in poor countries. About half of the exposed jobs in advanced countries are expected to benefit from AI.[3] This only shows that these jobs will be impacted, and it does not say that workers will lose their jobs. It is not yet known whether these jobs will grow at a faster rate than new jobs that require humans, but some of these numbers are starting to appear.
According to the Stanford Digital Economy Lab, employment for young workers between 22 and 25 who have jobs affected by AI is 19% lower than it would have been had it kept pace with less-affected workers. This is due to less hiring. The authors did not see this among experienced workers, found no evidence that AI caused unemployment in general, and note that the results are descriptive.[4] A recent Federal Reserve working paper found that coding employment slowed down after the introduction of ChatGPT. The slowdown is not explained by exposure to slowing industries, and coding jobs continue to grow.[5]
There are also some studies that contradict this theory. Humlum and Vestergaard studied 25,000 Danes in 11 jobs that were affected by AI through December of 2024. They found no effect on wages or hours, their confidence intervals ruled out effects above 2%, and they also found no change in hiring of young workers at companies that used AI.[6] Fairlie and Wu found no significant increase in unemployment for recent graduates in the US when compared to others, using the Current Population Survey from June to August 2026.[7] These studies all look at different aspects of the labor market. Some look at current employees' wages and jobs, and others look at unemployment. Displacement has not yet appeared in the official numbers, but it could happen and not show up in these studies. It can take time for jobs to decline from what they would have been, and if workers are not hired, there is no unemployed worker to count.
1.3 How Increased Production Leads to Job Loss
There is a direct relationship between how many workers it takes to make a product, the total amount of product produced and how much each worker produces.
\[L = \frac{Q}{A} \tag{1}\]
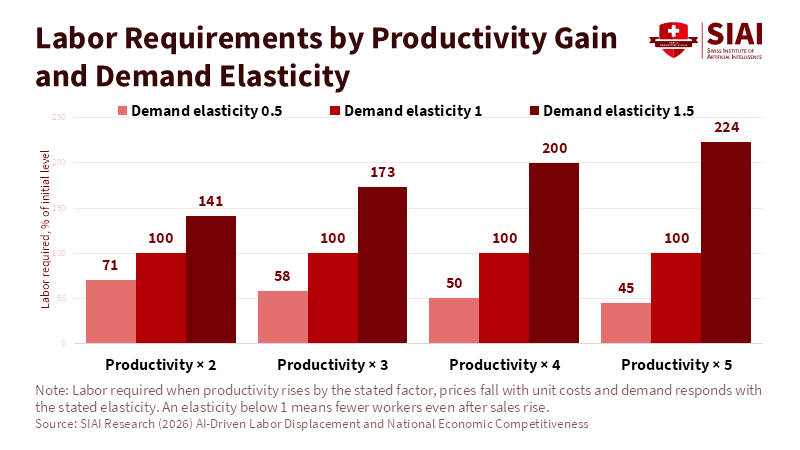
Where L is the labor needed to produce, Q is the quantity of goods produced, and A is the output per worker. If productivity increases fivefold and demand stays the same, then only 1/5th of the labor is needed. A multiplier of 5 is used for the rest of this paper. Few studies have measured actual increases of 5, but some show an increase in tasks completed per hour of 14% in a customer service role, and tasks taking 40% less time in one study.[8]
Labor will decrease, but how much it decreases depends on Q. Q is determined by quality, the ability of AI to take over and, most importantly, demand. Take a simple model where prices decrease as production increases. If productivity increases by a factor of a, prices will decrease by the same amount as unit cost, and demand will increase by a to the power of the elasticity. Equation 1 can be rewritten as
\[\frac{L_1}{L_0} = a^{\varepsilon-1} \tag{2}\]
Where ε is the elasticity of demand. If prices fall as production increases and supply meets demand, then any time the elasticity of demand is below 1, there will be a decrease in labor. If productivity increases by 5 and the elasticity is 0.5, labor will decrease to about 45%. If the elasticity is equal to 1, labor will stay the same. If it is greater than 1, for example 1.5, more than double the labor will be needed. A company that can produce 5 times the product cannot count on 5 times the demand.
Historical data has supported this theory. Bessen found that this simple model was able to describe employment in the textile, steel and auto industries in the US. Employment increased while demand was elastic, and once those industries became saturated and demand became inelastic, employment started to decline.[9] For the past 30 years, software and professional fields have had an elastic demand. One market that is showing signs of change is India. The National Association of Software and Service Companies is predicting a 6.1% increase in revenue to $315 billion for the fiscal year 2026. The industry is also adding 135,000 people, which is a 2.3% increase.[10] The Indian Council for Research on International Economic Relations surveyed 651 Indian IT companies between November 2025 and January 2026. 65% of respondents reported a decrease in hiring and 55% reported a decrease in entry-level positions, while 82% said there was no change to senior positions.[11] The report stated that AI will continue to help workers with high levels of skill. Only 27% expected headcount to decrease. Revenue and employment in this industry are growing at different rates, which is what this theory would predict. One company can keep all its employees and cause unemployment by taking market share from competitors.
1.4 Job Loss and Moving to Lower-Paying Jobs
There are four scenarios to look at when it comes to job loss: finding the same job, finding a job that pays less, finding short-term jobs and being displaced multiple times, and not finding work. The Bureau of Labor Statistics shows what is happening today. There were 3.3 million workers who lost their jobs in the 2023 to 2025 time frame after being employed for at least 3 years. By January 2026, 66.1% of those workers were employed, 18.3% were unemployed, and 15.7% were not in the workforce. Of those workers who had full-time jobs, 49% were making the same or more than they were. This is down from 62% who made the same or more two years ago.[12] Before any significant AI displacement, about 1/3 of these workers were not employed, and only about 1/3 of them were making the same amount or more.
Over longer periods of time, men who lose their jobs in a mass layoff take a loss of 1.4 years of wages in present value when the unemployment rate is less than 6%, and 2.8 years when it is over 8%.[13] When workers find jobs in lower-skill occupations, they take on more losses, and both the chance and the cost of this move rise in recessions.[14] So when workers lose their jobs, they may move to lower-paying jobs, which will cause them to take on even more losses. If someone who used to be a professional moves to a job that is more service-oriented, or becomes a gig worker, they are taking a loss on their human capital.
Research hypothesis H1: The more jobs that are affected by AI, the less likely a worker is to find a comparable job, and the more they will lose wages over their career.
2. Structural Dimension I: Physical AI
2.1 Differences Between Software and Physical AI
Physical AI is going to affect jobs that have not been impacted by software AI. While software AI has been able to mimic white-collar jobs, physical AI has only been seen in demos. Machines have been able to manufacture products in a factory, but only in very controlled environments where there are limited jobs that need to be performed. Physical AI will be able to work in a broader range of environments and do a wider range of tasks. Once physical AI becomes more advanced, jobs that software AI cannot take over could become obsolete.
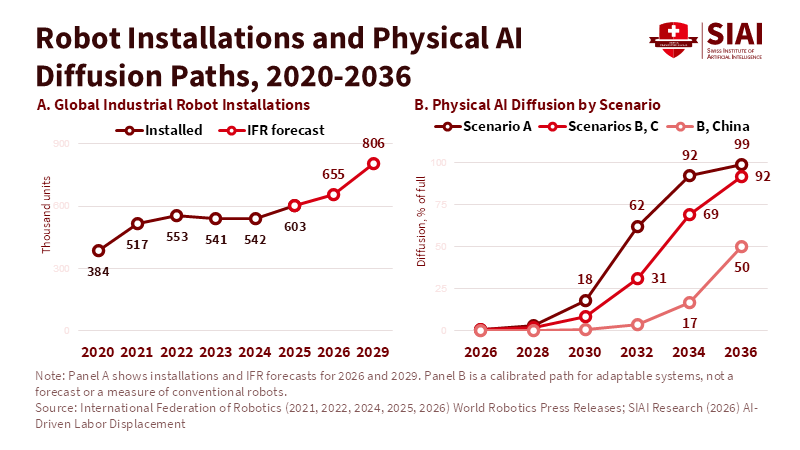
There are about 5 million industrial robots that are working in factories around the world. That number increased by 9% in 2025, with more than 600,000 new robots put into factories.[15] The most notable example of a humanoid working in a factory comes from Figure, which placed two of its robots at a BMW plant in Spartanburg over 11 months. The robots worked for 1,250 hours and loaded over 90,000 parts. BMW and Figure have not released any information about whether the robots met their goals, how often they failed or how much they cost to operate.[16]
2.2 2028 as the First Possible Year that Robots Can Replace Humans
This paper looks at 2028 as the first year that robots can take over from humans. The date is a research scenario and carries no business forecast. There are several steps that physical AI needs to go through, from labs to commercial applications, to work in actual factories, to widespread adoption. Right now, it is in the demo phase, with some companies starting to test robots in factories. Hyundai expects to have Atlas sequencing parts in its Georgia plant by 2028 and assembling components by 2030, after it can validate each step. It plans on producing 30,000 per year by 2028.[17]
So the year that robots can take over from humans will be when it is cheaper and more efficient to use a robot. There are three scenarios, which allow for errors and production issues: 2028 is the fastest scenario, 2029 is the normal scenario, and 2032 is the worst-case scenario.
2.3 How Cheap Can Robots Be to Operate?
The more expensive labor becomes, the more attractive it is to use robots. Below is a formula that can be used to calculate how much it will cost to run a robot.
\[C_R = \frac{P_R-S_R}{n_R N_R} + M_R + E_R + I_R \tag{3}\]
Where PR is the cost to buy and implement the robot, SR is the salvage value of the robot discounted over the years, HR is the number of hours the robot can produce per year, NR is how many years the robot can be used, MR is maintenance cost per hour of production, ER is energy cost per hour of production, and IR is any cost associated with running the robot per hour of production. Robots are assumed to be financed at a real rate of 8%, and that cost is compared to the cost of a human. There are many costs that come with running a robot, and it will not be free to operate, so the comparison looks at how much it costs to produce something with a robot versus a human.
A robot can cost the same in Germany and Vietnam, but labor in Germany is going to cost about $50 an hour, and in Vietnam it will be around $2. Once robots are able to produce the same goods as a human, countries with higher wages will have an incentive to use them, while countries with lower wages may not be able to justify using them.
Research hypothesis H2: The cost of labor will increase the profit motive for physical AI to take over from humans.
2.4 Why Western Europe May Benefit
The countries of interest here are ones that have higher wages: Germany, Switzerland, the Netherlands, Sweden and others. Many of these countries have given up manufacturing jobs because of the cost of labor. If robots can do these jobs and require fewer workers, lower wages in other countries will matter less. There will be many other factors that determine where companies build: research and development, access to energy, patents, where they can buy and sell products, and the ability to invest in robots. Most of these countries have good access to these.
One counterargument is that these countries are not ahead of other countries. China had 354,000 robots installed in 2025, which is 59% of the world's installations. The EU only added 60,500 robots in 2025, which was an 11% decrease, and Germany decreased by 8%.[18] These numbers only show how many robots are being installed. Europe has no reason to install robots that are not ready to take over. China will install robots because it has the scale and the domestic supply to build them. Europe will see higher savings by replacing one worker than China will see by replacing one. In 2024, Germany had 449 robots per 10,000 manufacturing workers, Sweden had 377, and China had 166. The world average was 132.[19] These countries will see higher profits from selling goods, and they can invest that money back into robots and research. These countries will not see an increase in blue-collar jobs.
2.5 What Will Happen to Developing Countries
Many developing countries have been able to get jobs in the world market because of their low cost of labor. If robots can do these jobs and reduce labor costs, then those countries may not be able to compete. Countries that rely on manufacturing to grow may not be able to. Rodrik has shown that there are fewer countries that are able to industrialize, and those that can industrialize are doing so at lower income levels.[20]
There has been some research that has shown that when U.S. factories adopted robots, employment in Mexico dropped. Those affected were workers with low education who worked around machines, and exports also dropped.[21] Another study looked at many different countries and found that when rich countries started to use robots, they traded more with poor countries, and their net imports from those countries fell. In the study's model, poor countries were better off.[22] Both of these studies looked at traditional robots, not the type expected in the next few years. Countries that are able to adopt robots, or those finding other ways to create human capital, may benefit.
Research hypothesis H3: Declining quality-adjusted robotic production costs reduce the competitive advantage derived from low manufacturing wages, especially in economies with limited technological and institutional capacity.
2.6 Empirical work
Table 1 compares fourteen countries. Labor costs are taken from or calculated using Eurostat, BLS and JETRO. Robot figures are engineering assumptions and are not observed values, since there is no dataset to reference. The installation cost decreases from $150k in 2026 to $80k in 2029 to $45k in 2036, which is fairly in line with the IDTechEx prediction of humanoid robots averaging around $115k in 2024 with a reduction to $37k by 2030, once integration is added.[23] The number of hours per year the robot will run increases from 3,000 hours to 5,500, which is significantly more than anything publicly available. The amount of work completed per hour relative to a human worker increases from 0.35 to 1.
In the base case, the break-even point for a country's labor cost will decrease from around $78/hr in 2026 to $11/hr in 2029, around $6/hr in 2032 and $3.80/hr in 2036. Since cost parity cannot come before validation, the latter of the two dates is used as the first possible year. High labor-cost countries will therefore become possible once robots are ready for production: Germany, the Netherlands, Sweden, the United States, Japan, the Czech Republic, and Poland in 2029, Mexico in 2033 and China in 2034. Malaysia, Thailand, Indonesia, India and Vietnam will not reach the break-even point until after 2040. Changing one variable at a time, such as a robot cost of $120k, 3,500 hours, maintenance of $5/hr, output at 0.6, or a financing rate of 12%, will only raise the 2029 break-even point to somewhere around $12-$14/hr.
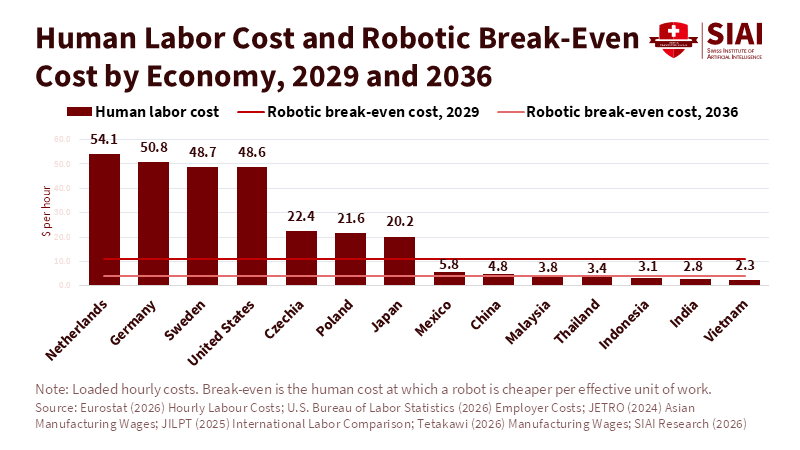
Table 1. Industry-Level Automation Exposure and Labor-Cost Comparisons
| Economy | Labor cost, $/hour | Cost / break-even 2029 | Cost / break-even 2036 | First viable year, accelerated | First viable year, baseline | First viable year, pessimistic | $/hour at 80% automated, 2036 | Saving, $/hour |
| Netherlands | 54.13 | 4.90 | 14.25 | 2028 | 2029 | 2032 | 15.47 | 38.65 |
| Germany | 50.85 | 4.60 | 13.39 | 2028 | 2029 | 2032 | 14.71 | 36.14 |
| Sweden | 48.70 | 4.41 | 12.82 | 2028 | 2029 | 2032 | 14.22 | 34.49 |
| United States | 48.62 | 4.40 | 12.80 | 2028 | 2029 | 2032 | 14.20 | 34.42 |
| Czechia | 22.37 | 2.02 | 5.89 | 2028 | 2029 | 2032 | 8.11 | 14.27 |
| Poland | 21.58 | 1.95 | 5.68 | 2028 | 2029 | 2032 | 7.92 | 13.66 |
| Japan | 20.16 | 1.82 | 5.31 | 2028 | 2029 | 2032 | 7.59 | 12.57 |
| Mexico | 5.79 | 0.52 | 1.52 | 2032 | 2033 | 2036 | 4.26 | 1.53 |
| China | 4.81 | 0.44 | 1.27 | 2033 | 2034 | 2037 | 4.03 | 0.78 |
| Malaysia | 3.76 | 0.34 | 0.99 | After 2040 | After 2040 | After 2040 | 3.76 | 0.00 |
| Thailand | 3.42 | 0.31 | 0.90 | After 2040 | After 2040 | After 2040 | 3.42 | 0.00 |
| Indonesia | 3.15 | 0.28 | 0.83 | After 2040 | After 2040 | After 2040 | 3.15 | 0.00 |
| India | 2.81 | 0.25 | 0.74 | After 2040 | After 2040 | After 2040 | 2.81 | 0.00 |
| Vietnam | 2.28 | 0.21 | 0.60 | After 2040 | After 2040 | After 2040 | 2.28 | 0.00 |
Note: Labor costs are observed or calculated, and all other columns are estimates. South Korea, Switzerland and Singapore are excluded for lack of comparable data.
Robots do not need to be cheaper than Vietnamese workers to have an effect, and they will not be, but they will lower the differential. With 80% of hours automated in 2036, the cost of labor in Germany will go from around $51/hr to $15/hr. In the United States, it will go from around $48.60 to $14, a saving of over $34. China will see a saving of less than $1, and Vietnam none. The differential between Germany and Vietnam will go from around 22:1 to 6.5:1, and with 95% automation, it will be 3.5:1. A country's ability to compete based on labor costs will decrease by at least two-thirds but not disappear, and Germany will still cost more to run.
3. Structural Dimension II: Advanced Human Capital and Ability to Adapt
3.1 Moving from a labor cost advantage to research and innovation advantage
Structural Dimension II looks at a country’s ability to create workers who have knowledge that is economically beneficial. This paper refers to this as advanced human capital: people who have science, math, engineering, or other skills that can be used to innovate and advance technology. If robots are going to be doing manual labor and AI will be doing mental tasks, humans who can think will still be needed. The amount of advanced human capital a country has will become more important as economies rely less on cheap labor. A college degree alone does not show advanced human capital, since a degree does not show that someone can do research.
3.2 Building Advanced Human Capital Takes Time
People will take time to learn how to think. It takes time to educate someone, and if that person did not learn how to think at a young age, it will be harder for them to learn. There will be no jump in how fast people can think just because machines can teach faster. AI can help students and researchers, but it will not fix bad math or poor understanding of science. Someone who cannot do math will not know if AI is right.
This paper assumes that it will take about 20 years to create advanced human capital and about 40 years to incorporate that into a working economy. These are not hard-and-fast times. But workers who can do research and development in 2036 are already in high school or beyond, so what matters is what each country did before ChatGPT. Hanushek and Woessmann argued that there is a causal link between cognitive ability and growth, separate from years of schooling.[24]
Research hypothesis H4: Countries that already have high levels of advanced human capital will be able to adapt to AI better than countries that try to learn after AI has become prevalent.
3.3 How to measure advanced human capital
Measures should not only look at college or degrees. Better measures look at base knowledge, number of researchers, people with advanced degrees, the amount of quality research done, and whether a country is able to do research.
Number of publications can be skewed. If a country is trying to get more publications, it can produce papers of little value, and the same is true of patents. The Advanced Human Capital Index therefore only uses two inputs: the 2022 PISA math score and number of researchers. Publications, patents and exports are left as outputs. Some countries score higher on test scores than others. Singapore scored 575 on the PISA test in 2022, Japan scored 536 and Korea scored 527. Switzerland scored 508 and Germany 475. The OECD average was 472. The United States scored 465 and Mexico 395.[25] Vietnam scored 469, with far fewer researchers than the United States.
3.4 Looking at countries
Some countries do more research than others, whatever their income. According to the World Bank, the United States spends 3.45% of its GDP on research, Germany 3.15%, Sweden 3.60% and Japan 3.44%. Korea spends 4.94% of its GDP on research and has 9,472 researchers per million, the highest in the sample.[26] Korea's GDP per person employed is only 63% of the United States level, Japan's is 56% and Germany's is 80%.
China is making the jump from being a labor country to one that will research. It currently spends 2.58% of its GDP on research and has 2,107 researchers per million, less than half of the United States. According to the WIPO Innovation Index, China ranked 10th in 2026, coming in 22nd in input and 5th in output. Singapore ranked 1st in inputs and 9th in outputs. Germany was 14th and 8th.[27] Since these are outputs, they can be skewed by quantity.
3.5 Countries cannot simply buy technology
One could argue that a country can just buy technology, with AI becoming more accessible. This may be true for basic technology. But a country that does not have advanced human capital will not know if that technology is good or bad. It will have no way to verify it, no way to create its own and no way to improve upon others.
There have been studies done that show that with AI, the top researchers will publish more. Hao, Xu, Li and Evans studied 41.3 million papers in the natural sciences. They found that researchers who use AI tools published 3.02x as many papers, received 4.84x as many citations, and were able to lead projects 1.37 years sooner. The downside was 4.63% fewer topics studied and 22% less engagement among scientists.[28] These are associations and probably mix selection with effect. But if AI allows top researchers to do more, then countries with highly advanced human capital may benefit more.
Research hypothesis H5: AI will increase the ability of advanced human capital, causing more of a gap between countries.
3.6 Empirical Work
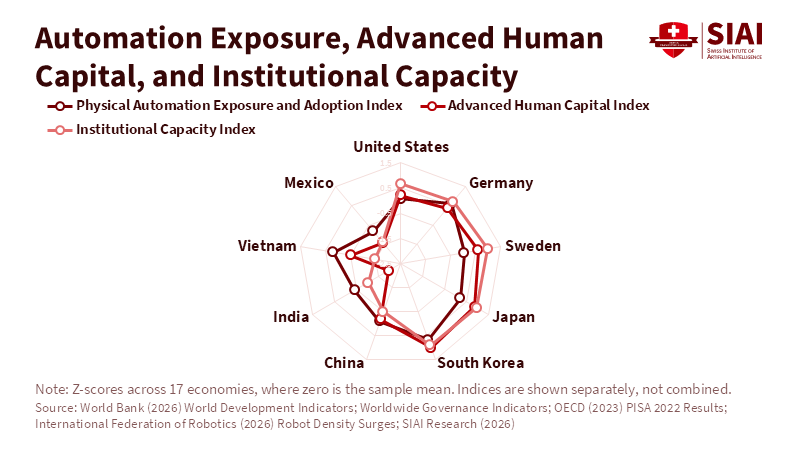
An Advanced Human Capital Index was created using available data. The terms are defined in Table 2, and the countries are shown in Table 3. Publications and other innovations were left out as inputs, since the aim is to see what countries can do. Singapore, Korea, Japan and Switzerland have the highest numbers. Germany and the United States are lower due to their PISA scores. China and India are only measured by one input, as they do not have PISA data. Compared with the Global Innovation Index, the index had a Spearman rank correlation of -0.77, where a lower rank is better. Since there is no data on people with advanced training or quality research, these numbers are not final.
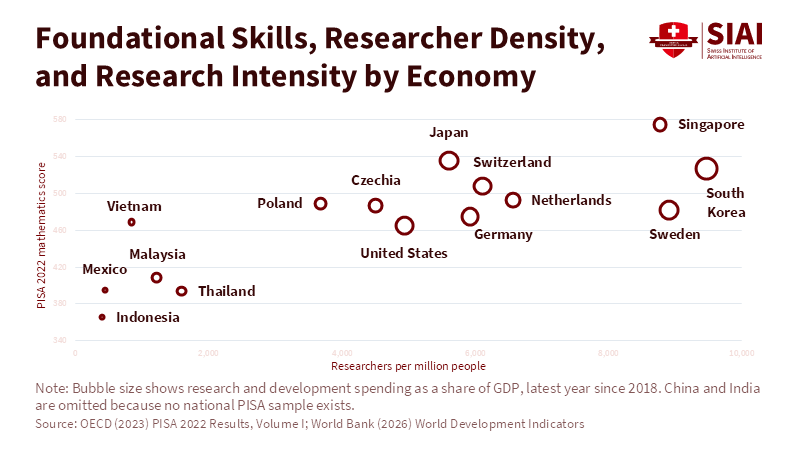
Table 2. Definitions of Structural Dimension Indices
| Index | Components in this version | Construction | Coverage |
| Physical Automation Exposure and Adoption Index, PAEAI | Log loaded hourly labor cost; industry share of employment; log robot density per 10,000 manufacturing employees | Equal-weight mean of z-scores over available components | 17 economies; labor cost missing for 3, density for 8 |
| Advanced Human Capital Index, AHCI | PISA 2022 mathematics mean score; log researchers per million people | Equal-weight mean of z-scores over available components | 17 economies; PISA missing for China and India |
| Institutional Capacity Index, ICI | Government effectiveness 2023; regulatory quality 2023; research and development as a share of GDP | Equal-weight mean of z-scores | 17 economies, complete |
Note: Z-scores use all 17 countries, and the indices are not combined.
Table 3. Country-Level Baseline Indicators
| Economy | R&D, % GDP | Researchers per million | PISA math | Industry, % empl. | Robot density | Gov. effect. | Reg. quality | PAEAI | AHCI | ICI |
| United States | 3.45 | 4,937 | 465 | 18.9 | 307 | 1.29 | 1.42 | 0.08 | 0.21 | 0.67 |
| Germany | 3.15 | 5,926 | 475 | 26.0 | 449 | 1.57 | 1.37 | 0.61 | 0.38 | 0.71 |
| Switzerland | 3.22 | 6,108 | 508 | 19.6 | 294 | 2.06 | 1.69 | -0.44 | 0.67 | 1.07 |
| Sweden | 3.60 | 8,911 | 482 | 16.8 | 377 | 1.72 | 1.65 | 0.05 | 0.61 | 0.99 |
| Netherlands | 2.27 | 6,563 | 493 | 13.8 | n.a. | 1.77 | 1.60 | -0.17 | 0.57 | 0.68 |
| Japan | 3.44 | 5,609 | 536 | 23.2 | 446 | 2.03 | 1.35 | 0.22 | 0.88 | 0.96 |
| South Korea | 4.94 | 9,472 | 527 | 23.4 | 1,220 | 1.49 | 0.95 | 0.68 | 1.02 | 0.91 |
| China | 2.58 | 2,107 | n.a. | 31.8 | 166 | 0.61 | -0.11 | -0.10 | -0.18 | -0.49 |
| India | 0.65 | 259 | n.a. | 25.8 | n.a. | 0.51 | -0.13 | -0.41 | -1.95 | -1.01 |
| Vietnam | 0.41 | 836 | 469 | 34.8 | n.a. | -0.19 | -0.32 | 0.21 | -0.50 | -1.45 |
| Indonesia | 0.28 | 395 | 366 | 22.5 | n.a. | 0.39 | 0.31 | -0.62 | -1.70 | -0.96 |
| Thailand | 0.94 | 1,592 | 394 | 22.2 | n.a. | 0.28 | 0.12 | -0.61 | -0.87 | -0.93 |
| Malaysia | 1.01 | 1,218 | 409 | 26.0 | n.a. | 0.77 | 0.60 | -0.28 | -0.86 | -0.49 |
| Mexico | 0.25 | 438 | 395 | 24.5 | 62 | -0.11 | -0.15 | -0.81 | -1.41 | -1.38 |
| Singapore | 1.81 | 8,782 | 575 | 14.0 | 818 | 2.10 | 2.13 | -0.29 | 1.40 | 0.94 |
| Poland | 1.56 | 3,675 | 489 | 30.0 | n.a. | 0.64 | 0.69 | 0.74 | 0.30 | -0.38 |
| Czechia | 1.83 | 4,505 | 487 | 34.9 | n.a. | 1.22 | 1.14 | 1.13 | 0.36 | 0.13 |
Note: Observed data are from the latest year since 2018, with indices calculated for this paper. N.A. means not available.
4. Structural Dimension III: Institutions
4.1 Countries need institutions to utilize their human capital
The last dimension is whether a country can use its advanced human capital. People who can research and improve also need investment, labs, other people to work with, and a country that will allow them to work. Many countries have advanced human capital, and the question is whether they can utilize it.
4.2 Financing research
Take a scientist who knows how to create better energy. If the country does not have people who know about science, money to invest and labs to do the work, that scientist may not be able to create the invention. The country may not even know that its scientists can create something. If a country does not have people who know, it will not know who to invest in. That person will become frustrated, years of their work will be lost, and the money can go to someone who may not know what they are doing. Eventually, that person will find a country that allows them to do what they know.
4.3 Money
Money alone is not enough, since the right people also have to spend it. There may be money to research, but if that money is not invested correctly, there will be no benefit. Europe is a great example. The SIAI series showed that the EU has €150B in venture capital, while the United States has €930B. 10% of scale-ups in Europe are leaving, and 85% of those are going to the United States. Almost 30% of unicorns left Europe from 2008 to 2021.[29]
4.4 Selling human capital
Once there are more robots and AI, the need for certain labor will go down. Countries will have to compete for people who can research and create. If a country does not allow these people to do what they know, they will leave. German Jewish chemists who fled to the United States after 1933 increased U.S. patents in their fields by at least 31%.[30] While this is not normal, it shows that a field of science can be increased by just bringing in more people.
With remote work, people can now leave their country without leaving. Someone who can work from home can be doing that for a foreign country. But research will require people to be on site, so people will still need to move to increase their income or move their money.
4.5 Competing with other countries
Take two similar countries, one that decides to improve its institutions and one that does not. A difference may appear by 2036, and Scenario C in Section 8 will show this. Countries can change their institutions, but it takes time. A country can change laws in one year, but it may take years to see results, so 10 years is a demanding horizon.
Research hypothesis H6: A country with high levels of advanced human capital will benefit more if it has good institutions, and countries with poor institutions will have a harder time.
4.6 Empirical Work
The World Bank's government effectiveness and regulatory quality scores, along with research spending, are used to create an institutional index. Venture finance, infrastructure, migration and commercialization are planned additions. The Spearman rank correlation between the two indices is 0.90.
Table 4 tests whether institutions affect growth, using 2005 institutions, and finds no clear effect. With 5-year data and country and time fixed effects, no interaction is significant except for one at the 10% level. In the long run, looking at growth from 2005 to 2024, the interaction with research intensity is -0.37 at the 10% level, and with researchers per million it is -0.38 and not significant. For IP receipts, institutional quality is significant at the 5% level, with a coefficient of 0.59.
There may be no correlation with growth because countries with weaker institutions may be growing by adopting technology and not by researching. There is also a high correlation between institutions and research inputs, so an effect may be hard to find. H6 may still be true. Institutions may affect where value is captured and whether countries keep their human capital, which is looked at in Section 7.
Table 4. Regression Results
| Dependent variable | Research input | Input | Institutions | Input × institutions | N |
| Panel A: five-year panel, country and period fixed effects | |||||
| Growth, GDP per worker | R&D intensity | 1.53 (0.95) | absorbed | -0.63 (0.71) | 395 |
| Growth, GDP per worker | Researchers | 0.97 (0.80) | absorbed | 0.37 (1.16) | 327 |
| High-tech share of exports | R&D intensity | 0.23 (1.66) | absorbed | 1.41 (1.33) | 366 |
| High-tech share of exports | Researchers | 0.82 (3.39) | absorbed | 4.08 (4.72) | 310 |
| IP receipts, % GDP | R&D intensity | -0.13 (0.14) | absorbed | 0.20 (0.16) | 337 |
| IP receipts, % GDP | Researchers | 0.19 (0.19) | absorbed | 0.59* (0.34) | 288 |
| Panel B: long-run cross-section | |||||
| Growth, GDP per worker, 2005-2024 | R&D intensity | 0.54 (0.37) | 0.03 (0.25) | -0.37* (0.22) | 97 |
| Growth, GDP per worker, 2005-2024 | Researchers | 0.97** (0.42) | 0.21 (0.41) | -0.38 (0.26) | 74 |
| Log IP receipts, 2015-2024 | R&D intensity | 0.45 (0.29) | 0.59** (0.29) | -0.07 (0.20) | 73 |
| Log IP receipts, 2015-2024 | Researchers | 0.34 (0.38) | 0.66 (0.95) | -0.11 (0.72) | 58 |
| Log high-tech share, 2015-2024 | R&D intensity | 0.37* (0.21) | 0.08 (0.18) | -0.10 (0.12) | 89 |
| Log high-tech share, 2015-2024 | Researchers | 0.29 (0.26) | -0.15 (0.33) | 0.36 (0.25) | 71 |
Note: Standard errors in parentheses; ** and * mark 5% and 10% significance. Results are associations, and “absorbed” means the term drops out under fixed effects.
5. Combining Structural Dimensions
5.1 How will this affect a country’s economy
These three structural dimensions can be combined to see how a country will be affected. Some countries may be higher on all three, and some may be lower. A country's economy can be shown as:
\[\begin{aligned}g_{it} = {} & \alpha_i + \lambda_t + \beta_1 A_{it} + \beta_2 H_{it} + \beta_3 I_{it} \\ & + \beta_4(A_{it}H_{it}) + \beta_5(H_{it}I_{it}) + \beta_6(A_{it}I_{it}) \\ & + \gamma X_{it} + u_{it}\end{aligned} \tag{4}\]
Where g is the growth rate of a country, A is how much AI it has adopted, H is advanced human capital, I is institutional capacity, X are other economic variables, and α and λ are country and time fixed effects. This is not a causal model, and reverse causality still needs to be addressed.
There are many things that can be looked at: employment, displacement, wages, manufacturing, research, GDP or tax revenue. Robots can have different effects on countries.
5.2 Effects
There are three pairs to look at: robots and advanced human capital, robots and institutional capacity, and advanced human capital and institutional capacity. The last one can be tested, as was done in Section 5.6. The other two cannot be tested, as there is no data on how many robots a country has or what type. There are some countries that have high scores on all three: Germany, Korea and Japan. Mexico scores low on all three. Vietnam has high exposure, decent test scores and poor institutions.
There may be a nonlinear effect. Countries may not see an effect until they have a certain number of robots and people who can work with them. Section 8 builds in this relationship, but it is not known whether this was true in the past.
5.3 Countries may diverge
Countries that have access to AI may all benefit. Developers in Jakarta will be able to use the same AI as those in Berlin. But countries that already have advanced human capital and good institutions may see higher growth and be able to capture more money. Countries that rely on cheap labor will lose that advantage and may not be able to compete in other areas.
Research Hypothesis H7: Countries that adopt AI quickly will see more divergence in growth, competitiveness and tax revenue.
6. National Tax Bases
6.1 SIAI Series and Taxes
The SIAI AI and Tax series showed that if a country does not have the right mix of taxes, it may lose tax revenue even with an increase in productivity. If a worker becomes more productive by €100, the government will collect €16 of tax. If €40 of that goes to foreign companies, it will only collect €8. These figures depend on illustrative tax rates.[31] So a country with less labor may see less taxes.
\[Y_t = w_t L_t + r_t K_t \tag{5}\]
A government budget constraint can be created.
\[\tau_L w_t L_t + \tau_K r_t K_t \geq B_t + G_t \tag{6}\]
Where τL is taxes on labor, τK is taxes on capital, B is transfers related to AI, and G is other government spending. It is not known whether labor income will decrease. There may be fewer people working, but they may be paid more. If 10 workers making $100k are replaced with 2 making $300k, taxable payroll will decrease by 40%, but income tax may only go down by 15%. If people are taxed at 15% up to $50k, 25% up to $150k and 35% over, income tax will go from $200k to $170k. If one of those people leaves the country, only $85k will be collected, which is a decrease of 57.5%. Labor income will not always decrease, and if output is high enough, wages can increase.
6.2 People may leave
There will be people who can leave their country and still make money: highly paid professionals, entrepreneurs and people with money. Kleven, Landais, Muñoz and Stantcheva showed that some people will leave their country if taxes are too high, but this is not always the case. It depends on who they are and what they do. The authors caution against using this as a general argument against taxing the rich.[32]
The United Kingdom gives a recent example with its non-dom and deemed dom residents. In 2024 to 2025, there were at least 81,900, which is down 1%. Their tax liabilities were £13.6B, which is up 9%.[33] These numbers end before the remittance basis was replaced in April of 2025, so they cannot show whether people will leave or just move their money. This paper assumes that some people will leave and some will not, depending on their job and how they make money.
6.3 Changing Taxes
There will be less tax on labor, but other taxes may increase. Labor-linked taxes bring in more than taxes on business: Social Security is 25.5% of taxes and income tax is 23.7%, while VAT is 20.5% and corporate tax is 11.9%. Countries that have high taxes on labor will see a decrease. Germany has 64.8% of its taxes from labor, the United States has 63.5% and Mexico has 34.6%.[34]
So countries that have high taxes on labor will need to find other ways to collect taxes. If they are not able to, they will not have enough money to provide services. The question is whether countries can collect a portion of what AI will create. Money paid to foreign AI companies will not be taxed at home. How capital gains are taxed also matters, as does whether their owners live in the country.
6.4 Can countries afford to provide services
There will be an increase in spending on social programs, and one-time spending needs to be separated from spending that will continue. There will be an increase in government spending due to displacement, but how long it will last is not known. The government budget constraint is:
\[D_{t+1} = (1+r_t)D_t + G_t + B_t - T_t \tag{7}\]
Where D is debt, r is the interest rate, G is other government spending, B is transfers related to AI, and T is taxes. A country will not be insolvent just because it spends more than it collects for a time. But if it continues to do that, it will not be able to provide services. The EU spends €4.9 trillion on social protection, which is 27.3% of GDP.[35] It will have little room to increase its spending at this level, and the same applies to countries with low tax revenue.
6.5 Why conventional transition insurance may become insufficient
As an example of policy design that attempts to address these issues, consider the proposal by Robert E. Litan put forward at Brookings in October of 2026. It is worth considering as it is well fleshed out, has costs attached and is argued well. The proposal offers wage insurance, training support and a tax credit for hiring entry-level workers. Costs are estimated to be $38 billion, $11.5 billion and $11 billion at the midpoints, respectively. That would amount to roughly $60 billion per year in 2025 dollars if unemployment stayed at 6 percent.[36] Workers who are involuntarily unemployed and have at least 3 years of service would receive 80%, 60% and 40% of their lost wages over 3 years. This proposal builds on findings that a small U.S. program increased employment in the short term and increased wages in the long term, resulting in a net benefit.[37] The proposal does what it sets out to do, which is ease the transition.
If one assumes that displaced workers will be able to find new employment, this becomes a valid instrument. Since it is based on being employed, the expected benefit can be represented as:
\[E[B] = p_R \cdot E[C \mid R] \tag{8}\]
Where pR is the probability of being reemployed in a qualifying position and C is the compensation received from being reemployed. If pR decreases, then the expected benefit decreases, so it will provide the least help in that state of the world. Scaling this linearly from 4% unemployment and assuming a $30,000 average loss in earnings is acceptable when discussing a normal business cycle. But if many of those alternate jobs are automated, or there are more people competing for jobs after training, this will not be true.
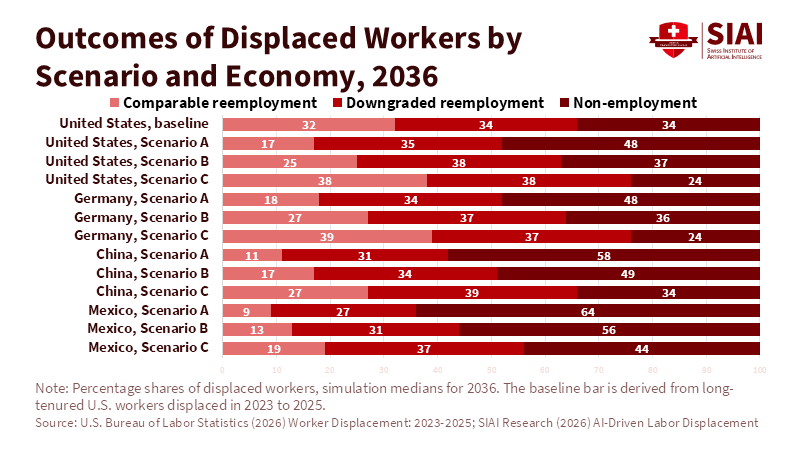
Using the simulation in Section 8, workers who take a loss when reemployed make up between 35 and 38 percent of workers who are displaced in the U.S. across all 3 scenarios. The difference is in those who are not employed. Under the current BLS baseline, 34% of workers are not employed after displacement. In Scenario A, that number rises to 48%, and in Mexico and Vietnam it rises to 64%. Providing some form of income to those who are not employed in Scenario A would take a median of 0.77% of U.S. GDP in 2036, with a range from 0.5% to 1.2% at the 10th and 90th percentiles. In Scenario B, it is 0.39% and in Scenario C, 0.23%. The proposed $60 billion would provide about 0.2%. These are different things, but the scale is useful. The proposal fits a good scenario and covers only a fraction of a bad one. The goal is to understand when certain policies become possible and when they do not, and no ideal is assumed.
Research hypothesis H8: Countries that experience job loss due to AI and cannot generate and capture enough of that money will see their ability to support their citizens decline.
7. Scenario analysis: National economic trajectories, 2026-2036
7.1 Baseline and projection periods
2026 is the base year. The next checkpoint is 2028/2029, when physical AI is expected to be more widespread, then 2031/2032, when commercial use cases become more widespread, and 2036, when countries become more differentiated. These are scenarios and should not be assumed as milestones.
This simulation is built into an accounting problem and should not be used to make any predictions. There are 8 countries in the simulations, and each one has an AI and non-AI scenario to compare against, so the results show what is different between the two paths. AI will diffuse along a logistic curve, and those who are displaced will either be reemployed in a similar job, reemployed in a lower job, or not employed. These numbers are pulled from BLS data and scaled by the index. Output will increase with the complementarity assumed in Section 6.2. Tax revenue is created by looking at current shares and what types of taxes will be affected by AI. Some money will leak out of a country depending on its institutions. Some countries will also see jobs lost to automation abroad, which will also lower revenue. There are 3,000 simulations run for each scenario across the parameter ranges listed in Table 5. Table 6 shows the median of each scenario and the range from the 10th to 90th percentile for debt. These ranges are best guesses and not estimates.
Table 5. Scenario Assumptions and Parameter Ranges
| Calibrated parameter | Scenario A | Scenario B | Scenario C |
| Cognitive AI diffusion midpoint, ±1 year | 2029.5 | 2031 | 2031 |
| Physical AI diffusion midpoint, ±1.5 years | 2031.5 | 2033 | 2033 |
| Displaced share of exposed cognitive employment at full diffusion | 0.30-0.60 | 0.20-0.45 | 0.20-0.45 |
| Displaced share of exposed manual employment at full diffusion | 0.35-0.65 | 0.25-0.55 | 0.25-0.55 |
| Share of displacement offset by output expansion | 0.10-0.30 | 0.25-0.45 | 0.35-0.55 |
| Reemployment relative to BLS baseline of 0.661 | 0.60-0.80 | 0.75-0.95 | 0.85-1.05 |
| Pass-through of productivity to earnings | 0.20-0.40 | 0.30-0.50 | 0.40-0.60 |
| Mobility of high-income labor income | 0.20-0.40 | 0.10-0.30 | 0.05-0.20 |
| Change in ICI and AHCI by 2036, standard deviations | 0 and 0 | 0 and 0 | +0.75 and +0.25 |
| Common to all: level gain in output at full diffusion | 0.04-0.14 | 0.04-0.14 | 0.04-0.14 |
| Common to all: earnings loss when downgraded | 0.15-0.35 | 0.15-0.35 | 0.15-0.35 |
| Common to all: income replacement for non-employed | 0.25-0.45 | 0.25-0.45 | 0.25-0.45 |
| Common to all: indexation of spending to higher output | 0.50-0.90 | 0.50-0.90 | 0.50-0.90 |
| Common to all: capital income leakage | 0.05-0.25 | 0.05-0.25 | 0.05-0.25 |
| Common to all: demand lost to automation abroad, low-wage economies | 0.10-0.30 | 0.10-0.30 | 0.10-0.30 |
| Common to all: progressivity offset | 0.15-0.45 | 0.15-0.45 | 0.15-0.45 |
| Common to all: annual exit from non-employment | 0.05-0.15 | 0.05-0.15 | 0.05-0.15 |
Note: All values are calibrated assumptions drawn from uniform distributions, not estimates.
7.2 Scenario A: Rapid AI with no improvement in human capital and institutions
Assume that AI spreads rapidly and human capital and institutions do not improve. Cognitive AI peaks around 2029 and physical AI around 2031. The increase in demand will only offset 10-30% of the jobs lost, and reemployment will run 20-40% below today's rates. 14-16% of workers will be displaced over the course of the decade in the advanced countries, and about 14% in China and Mexico. Employment will be about 4% lower in the advanced countries compared to the path without AI, and about 5.5% lower in China and Mexico.
Output per worker will increase by 12-16% in the advanced countries compared to the path without AI, and total GDP will be about 8-11% higher. The emerging countries will see output per worker increase by 4-8% and total GDP increase by 0-2%. Debt increases by a median of 14.1 points of GDP in Mexico, with a range of 10.3 to 18.8. Vietnam will see debt increase by 11.2 points and India by 9.5. Germany will see debt increase by 4.0 points and the U.S. will see a slight decrease, with a range that includes zero. Japan sees debt decrease by 15.8 points, due to it starting with a very large debt.
7.3 Scenario B: AI continues to spread with uneven human capital and institutions
This is the middle scenario and what would be expected if things continued. Cognitive AI peaks around 2031 and physical AI around 2033. Employment will be about 2% lower in advanced countries and 2-3% lower in emerging countries. Advanced countries that have strong research and industrial institutions see a larger benefit from the productivity increase. Their debt-to-GDP ratio will be about 8.6 points lower in the U.S. and 4.9 points lower in South Korea. Germany will be about -2.6 points, with a range that includes zero. Mexico, Vietnam and India will see debt increase by 3.9-6.0 points. China will see debt increase by 1.1 points. Countries diverge from one another even though they all have access to similar technology.
7.4 Scenario C: Continued improvements in human capital and institutions
This scenario assumes continued investment in science and human capital and improving institutions. Institutions improve faster than human capital: by 2036 the ICI increases by 3/4 of a standard deviation and the AHCI by 1/4 of a standard deviation. Some workers will still be displaced, with employment 1-2% lower. The percentage that is not employed will drop to about a quarter of those who were displaced, and only about 0.2% of GDP will be needed to support them. Even in this scenario, emerging countries will see debt increase by 2.7 points in Mexico and 3.3 points in Vietnam. It will take longer than 10 years to improve two stages of human capital.
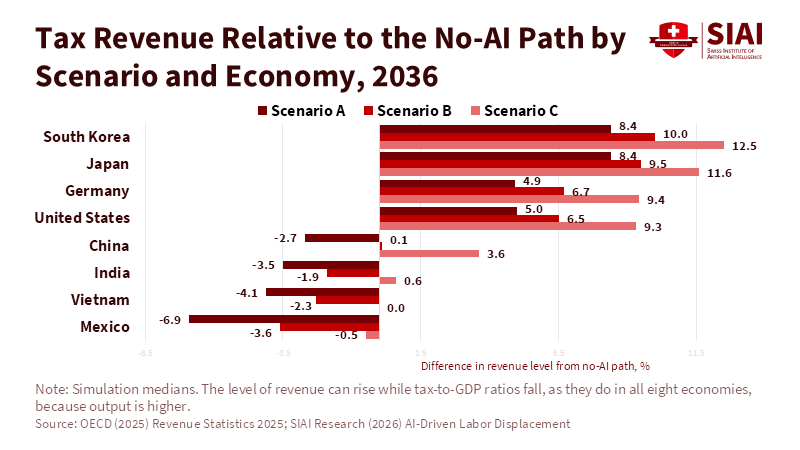
Tax revenue is something to consider as well. Tax as a percentage of GDP drops in every country, by between 0.3 and 1.2 points. But the advanced countries see more money coming in: 5-8% more than the path without AI in Scenario A and 9-13% more in Scenario C. In Scenario A, the emerging countries will see 3-7% less revenue. Having less money coming from personal income taxes is something to prepare for, but if output is generated at home, revenue can be higher.
7.5 Sensitivity analysis
Rank correlation shows which variables have the largest impact on debt. In all 3 scenarios, productivity from AI is the largest factor that affects debt, with a rank correlation between -0.46 and -0.77. The next largest variable in advanced countries is increasing the public budget to match higher output. This is only a factor in Scenarios B and C, with rank correlations of 0.39 and 0.43. In emerging countries, the number of workers who get displaced has a rank correlation of 0.27 to 0.45. Money that leaves a country from capital income is about 0.3, and the amount of demand that is lost to other countries through automation is 0.16 to 0.22.
The year that physical AI is adopted does not have much of an effect on debt by 2036, which supports treating 2028/2029 as a guideline year. Scenarios A and C are very different in terms of employment. This is due to the ranges picked for expansion and reemployment, which are the least known.
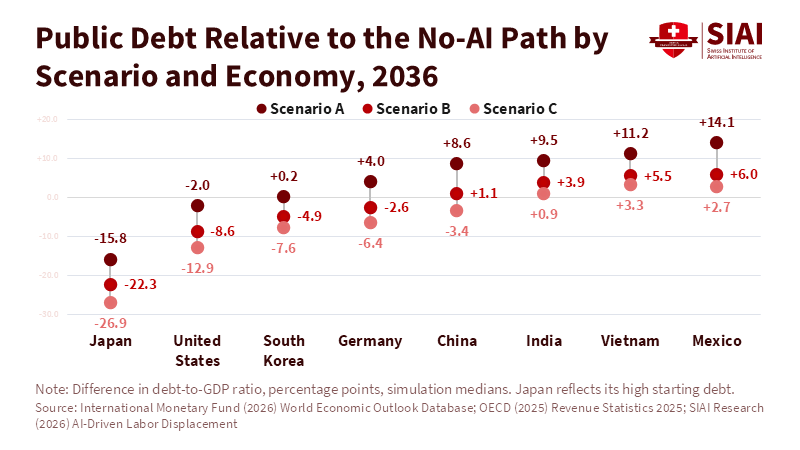
Table 6. Comparative Economic and Fiscal Projections for Selected Countries Through 2036
| Scen. | Economy | Output per worker, % | Employment, % | Labor-linked base, % | Tax ratio, pp GDP | Transfers, % GDP | Primary balance, pp GDP | Debt, pp GDP [10th, 90th] |
| A | United States | +12.4 | -3.9 | -3.4 | -0.67 | 0.77 | -0.91 | -2.0 [-9.0, +4.5] |
| A | Germany | +13.6 | -4.3 | -3.8 | -1.23 | 0.85 | -1.19 | +4.0 [-1.3, +9.5] |
| A | Japan | +15.1 | -4.0 | -3.5 | -0.60 | 0.77 | -0.45 | -15.8 [-27.3, -4.1] |
| A | South Korea | +15.5 | -4.1 | -4.0 | -0.52 | 0.80 | -0.62 | +0.2 [-4.9, +5.1] |
| A | China | +7.8 | -5.5 | -7.6 | -0.89 | 0.95 | -1.75 | +8.6 [+3.9, +13.9] |
| A | India | +3.6 | -3.3 | -8.1 | -0.65 | 0.57 | -1.22 | +9.5 [+6.2, +13.4] |
| A | Vietnam | +4.1 | -3.8 | -9.7 | -0.81 | 0.65 | -1.46 | +11.2 [+8.5, +14.8] |
| A | Mexico | +5.4 | -5.5 | -10.0 | -1.17 | 0.98 | -2.19 | +14.1 [+10.3, +18.8] |
| B | United States | +11.6 | -2.0 | -3.4 | -0.66 | 0.39 | -0.42 | -8.6 [-14.5, -3.2] |
| B | Germany | +12.8 | -2.2 | -3.9 | -1.21 | 0.43 | -0.59 | -2.6 [-7.3, +0.9] |
| B | Japan | +14.2 | -2.0 | -3.8 | -0.68 | 0.39 | -0.06 | -22.3 [-32.7, -11.7] |
| B | South Korea | +14.9 | -2.0 | -4.2 | -0.56 | 0.40 | -0.15 | -4.9 [-9.0, -1.5] |
| B | China | +6.8 | -2.8 | -5.6 | -0.70 | 0.49 | -0.99 | +1.1 [-2.3, +4.7] |
| B | India | +3.5 | -2.2 | -5.8 | -0.55 | 0.37 | -0.86 | +3.9 [+1.7, +6.3] |
| B | Vietnam | +4.1 | -2.7 | -7.0 | -0.66 | 0.46 | -1.05 | +5.5 [+3.5, +7.6] |
| B | Mexico | +4.8 | -3.2 | -7.1 | -0.90 | 0.55 | -1.39 | +6.0 [+3.5, +8.6] |
| C | United States | +12.9 | -1.2 | -3.0 | -0.53 | 0.23 | +0.02 | -12.9 [-19.5, -7.0] |
| C | Germany | +13.7 | -1.3 | -3.2 | -0.94 | 0.25 | -0.01 | -6.4 [-11.6, -2.6] |
| C | Japan | +14.8 | -1.2 | -3.4 | -0.55 | 0.23 | +0.38 | -26.9 [-38.1, -16.2] |
| C | South Korea | +16.0 | -1.2 | -3.8 | -0.44 | 0.23 | +0.26 | -7.6 [-12.4, -4.0] |
| C | China | +7.6 | -1.7 | -2.8 | -0.38 | 0.29 | -0.37 | -3.4 [-7.2, +0.3] |
| C | India | +3.9 | -1.5 | -2.6 | -0.32 | 0.25 | -0.45 | +0.9 [-1.3, +3.2] |
| C | Vietnam | +4.5 | -1.9 | -3.9 | -0.46 | 0.33 | -0.67 | +3.3 [+1.5, +5.0] |
| C | Mexico | +5.3 | -2.2 | -4.1 | -0.62 | 0.39 | -0.87 | +2.7 [+0.4, +5.1] |
Note: Simulation medians for 2036, shown as differences from the path without AI; transfers are a share of GDP. U.S. and Vietnam starting debt come from an undated republication
8. Research design and empirical implementation
8.1 Country selection
The comparison covers each advanced research country as well as China and India. Countries that rely on manufacturing are also compared, along with Singapore, Poland, and the Czech Republic, as they have different institutions, as seen in Table 3. All countries that have data and a population above 1 million are used, which gives up to 109 countries for the regressions. There is a smaller sample for the case studies, as no data could be found for Korea, Switzerland, and Singapore. They are not listed in Table 1.
8.2 Historical data period
The data goes back to 2000, as no earlier data is used. As this paper looks at generative AI and physical AI, what happened before 2022 cannot be directly applied, so this data is used to estimate how the scenarios may play out.
8.3 Empirical methods
The analysis first looks at descriptive statistics and compares the countries. It then runs a panel regression at the country level, with fixed effects for country and time. The data are averaged over 5 years because research takes time to increase and annual growth is volatile. As AI adoption is endogenous, there is the possibility of reverse causality, omitted variables and technology selection. Using institutions from 2005 and lagging research lowers these effects. Worker-level panels will be needed to accurately measure H1.
8.4 Composite indicators
This paper uses the Physical Automation Exposure and Adoption Index, along with the Advanced Human Capital Index and Institutional Capacity Index, all of which can be found in Table 2. These are normalized to a Z-score across the 17 countries and then averaged, with equal weights for each variable. Other ways to calculate these were tested, and the ICI without research had a correlation of 0.97 with the full ICI. The three indices are not averaged together to get one number, as there is no evidence that they should be. Having high exposure to automation is neither good nor bad, and it will depend on what a country can do.
8.5 Model validation
The model was tested using historical data. Growth from 2015 to 2024 can be predicted with an RMSE of 1.78 using the model of research, institutions, and their interaction. Using only initial income and investment gives 1.80. Using the average of 2015-2024 gives 1.58. The predictions cannot be validated using historical data. There is very little data on how AI will affect the labor market, with less than 4 years of data on generative AI and almost no data on physical AI. The simulation ranges may be too narrow.
9. Research hypotheses and expected contributions
There are 8 main hypotheses that this paper tests.
H1: Persistent labor displacement. This is conditionally supported. Workers have lost jobs from previous shocks, and early hiring data fit this pattern in the short term. There is no data on workers who have lost jobs specifically to AI. There are also 2 papers that show that AI has not affected employment yet.
H2: Relative labor cost and automation. This holds when looking at the cost of labor, but no country has implemented this automation yet.
H3: Erosion of low-wage comparative advantage. As seen in Table 1, high automation narrows the labor-cost gap with Germany by more than two-thirds, but the gap does not close. Mexico is showing that this could happen, but more evidence is needed.
H4: Human capital path dependence. It takes a long time to create human capital, so countries that want to benefit from AI need to start now. This cannot be tested just yet.
H5: Amplification of existing capabilities. Individuals who are already good at research see more output, but countries have not been looked at yet.
H6: Institutional complementarity. Institutions have no significant effect on growth in the regressions. They may play a role in how fast research can be commercialized, and this needs a deeper look.
H7: International divergence. As seen in Table 6, if the assumptions are correct, countries will become more different. This has not been seen yet.
H8: Fiscal sustainability. As seen in Table 6, debt pressure is clearest in Mexico, Vietnam and India under Scenario A, and these results are simulated.
This paper differs by looking at the effects that permanent job loss will have, how cheaper labor will become less desirable, and how countries can keep the workers who create advanced human capital. A country that cannot collect tax revenue will not be able to support its citizens.
10. Conclusion - AI and the future international economic hierarchy
Countries will not all see the same effects from AI. As the ability to produce increases, the need for some types of labor will decrease. Physical AI will decrease the need for cheap labor and increase the need for advanced research and engineering. The estimates support the direction of this shift, but how large it will be is not known. Countries with high wages will see the benefits first, as they will be able to automate. The labor-cost gap between low-wage and high-wage countries will narrow but not close. The regressions do not show that good institutions increase growth from research.
If a country cannot create or keep these workers, it will see employment problems, will not be able to compete, and will have to find a way to support its citizens. The simulations show that this could happen. The countries that benefit from AI may not be those with the most workers or the cheapest, and are more likely to be those that can use this technology and have the workers to support it. For policy, a country first needs to know what type of world it is in. If workers will be reemployed, then income support tied to reemployment will work. If not, other options will be needed. When deciding on what type of income to provide, a government should look at its reemployment rate, how much of the money the country is keeping, and whether it can keep workers who pay taxes. Improving research and institutions can start now.
References
[1] Autor, D., Chin, C., Salomons, A. and Seegmiller, B. (2024) 'New frontiers: the origins and content of new work, 1940-2018', Quarterly Journal of Economics, 139(3), pp. 1399-1465.
[2] OECD (2026) OECD Employment Outlook 2026: Geographic Disparities in Jobs and Incomes. Paris: OECD Publishing.
[3] Cazzaniga, M., Jaumotte, F., Li, L., Melina, G., Panton, A.J., Pizzinelli, C., Rockall, E. and Tavares, M.M. (2024) Gen-AI: Artificial Intelligence and the Future of Work. IMF Staff Discussion Note SDN/2024/001. Washington, DC: International Monetary Fund.
[4] Brynjolfsson, E., Chandar, B. and Chen, R. (2026) Canaries in the Coal Mine? Six Facts about the Recent Employment Effects of Artificial Intelligence. Stanford Digital Economy Lab working paper, revised 12 August.
[5] Crane, L.D. and Soto, P.E. (2026) AI and Coder Employment: Compiling the Evidence. Finance and Economics Discussion Series 2026-018. Washington, DC: Board of Governors of the Federal Reserve System.
[6] Humlum, A. and Vestergaard, E. (2026) Still Waters, Rapid Currents: Early Labor Market Transformation under Generative AI. Washington, DC: Brookings Institution, 6 October.
[7] Fairlie, R.W. and Wu, J. (2026) The Early Impacts of AI on Employment among Recent College Graduates. NBER Working Paper 35796. Cambridge, MA: National Bureau of Economic Research.
[8, 31] Lee, K. (2026a) [AI and Tax] Labor Income, AI Rents and Fiscal Erosion. SIAI Research. Schindellegi: Swiss Institute of Artificial Intelligence.
[9] Bessen, J. (2019) 'Artificial intelligence and jobs: the role of demand', in Agrawal, A., Gans, J. and Goldfarb, A. (eds) The Economics of Artificial Intelligence: An Agenda. Chicago: University of Chicago Press.
[10] Shinde, S. (2026) 'IT services to cross $300 bn milestone in revenue for FY26', Business Standard, 24 February.
[11] Indian Council for Research on International Economic Relations (2026) AI and Jobs: This Time is No Different. New Delhi: ICRIER.
[12] U.S. Bureau of Labor Statistics (2026a) Worker Displacement: 2023-2025. News release, 27 August. Washington, DC: U.S. Department of Labor.
[13] Davis, S.J. and von Wachter, T. (2011) 'Recessions and the costs of job loss', Brookings Papers on Economic Activity, Fall 2011, pp. 1-72.
[14] Huckfeldt, C. (2022) 'Understanding the scarring effect of recessions', American Economic Review, 112(4), pp. 1273-1310.
[15, 18] International Federation of Robotics (2026a) Five Million Robots Now Operate in Factories Globally. World Robotics 2026 press release, 24 September. Frankfurt: IFR.
[16] Assembly Magazine (2025) 'Humanoid robots complete trial project at BMW assembly plant', Assembly, 25 November.
[17] Repairer Driven News (2026) 'Hyundai showcases humanoid at CES, plans 30,000 units by 2028', Repairer Driven News, 7 January.
[19] International Federation of Robotics (2026b) Robot Density Surges in Europe, Asia and Americas. Press release, 8 April. Frankfurt: IFR.
[20] Rodrik, D. (2016) 'Premature deindustrialization', Journal of Economic Growth, 21(1), pp. 1-33.
[21] Faber, M. (2020) 'Robots and reshoring: evidence from Mexican labor markets', Journal of International Economics, 127, 103384.
[22] Artuc, E., Bastos, P. and Rijkers, B. (2020) Robots, Tasks, and Trade. CEPR Discussion Paper 14487. London: Centre for Economic Policy Research.
[23] IDTechEx (2026) 'Humanoid robots show clearer ROI, but commercial success depends on effective output', Automation.com, 14 May.
[24] Hanushek, E.A. and Woessmann, L. (2012) 'Do better schools lead to more growth? Cognitive skills, economic outcomes, and causation', Journal of Economic Growth, 17(4), pp. 267-321.
[25] OECD (2023) PISA 2022 Results, Volume I: What Students Know and Can Do. Paris: OECD Publishing.
[26] World Bank (2026a) World Development Indicators. Washington, DC: World Bank.
[27] World Intellectual Property Organization (2026) Global Innovation Index 2026. Geneva: WIPO.
[28] Hao, Q., Xu, F., Li, Y. and Evans, J. (2026) 'Artificial intelligence tools expand scientists' impact but contract science's focus', Nature.
[29, 35] Lee, K. (2026b) [AI and Tax] Europe's AI Race and the Fiscal State. SIAI Research. Schindellegi: Swiss Institute of Artificial Intelligence.
[30] Moser, P., Voena, A. and Waldinger, F. (2014) 'German Jewish émigrés and US invention', American Economic Review, 104(10), pp. 3222-3255.
[32] Kleven, H., Landais, C., Muñoz, M. and Stantcheva, S. (2020) 'Taxation and migration: evidence and policy implications', Journal of Economic Perspectives, 34(2), pp. 119-142.
[33] HM Revenue and Customs (2026) Statistics on Non-domiciled Taxpayers in the UK. Official statistics, updated 30 July. London: HMRC.
[34] OECD (2025) Revenue Statistics 2025. Paris: OECD Publishing.
[36] Litan, R.E. (2026) A Detailed, Affordable Plan for Transition Insurance in the AI Era. Washington, DC: Brookings Institution, 30 October.
[37] Hyman, B.G., Kovak, B.K. and Leive, A. (2024) Wage Insurance for Displaced Workers. NBER Working Paper 32464. Cambridge, MA: National Bureau of Economic Research.