[AI and Workforce] Talent and National Capability: Formation, Mobility, and Retention
Published
Keith Lee*
*Swiss Institute of Artificial Intelligence, Chaltenbodenstrasse 26, 8834 Schindellegi, Schwyz, Switzerland

International comparisons of AI talent typically treat each country as a single stock of skills and rank it by a number. This paper argues that national AI capability consists of three functions that should be measured separately: talent production, hosting and deployment within domestic businesses. Based on the NeurIPS conference researcher sample analyzed by MacroPolo, the Stanford HAI AI Index 2026 report, Eurostat and U.S. Census Bureau business surveys, as well as official policy documents, the analysis shows that countries' positions change substantially depending on the function being measured. China leads in producing higher-level researchers and the United States in hosting them, while the highest business use of AI in Europe is recorded in small northern economies that are not home to large cutting-edge labs. South Korea has the highest density of AI patents per capita and, at the same time a net outflow of AI professionals. The paper proposes a transparent matrix of indicators per country, in which one country can be strong in one function and weak in another, rather than a composite indicator. The analysis is descriptive. It does not substantiate causal effects of migration or education policy and the available data do not yet allow for the calculation of cohort retention rates for most of the twelve countries in the sample. The findings clarify the constraints facing talent sourcing and identify where workforce policy requires separate evidence.
1. Introduction - The Puzzle of National AI Capability
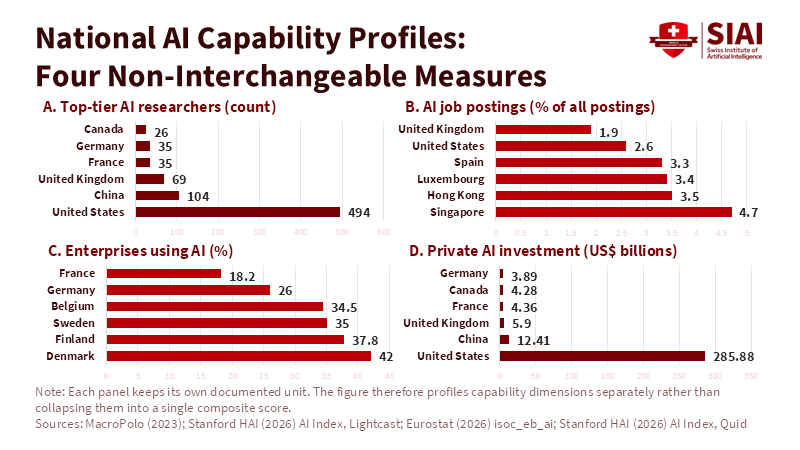
In 2025, private investment in AI in the United States amounted to $285.9 billion, more than twenty-three times China's total, although Chinese government guidance funds make the comparison underestimate total Chinese spending. In the same year, 1,953 new AI companies were funded in the U.S., more than ten times as many as the next country. And yet, according to Stanford HAI's AI Index 2026 report, the number of AI researchers and developers moving to the U.S. has fallen by 89% since 2017, with an 80% drop in the last year alone.[1] The two figures do not clash. They measure different functions of what is commonly called a national AI capability and the public debate merges them into a ranking that cannot explain how a country raises funds while losing flows of people.
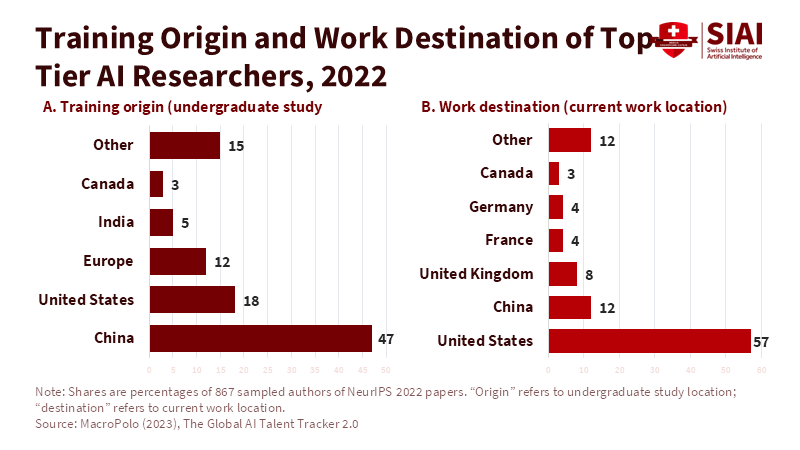
The same discrepancy occurs when the measure is changed. In the sample of researchers at the NeurIPS conference analyzed by MacroPolo, the share of higher-level researchers with undergraduate studies in China rose from 29% in 2019 to 47% in 2022, while the share of those working in the U.S. fell from 59% to 42% and China's counterpart rose from 11% to 28%.[2] But if the question shifts from cutting-edge research to everyday use by businesses, the picture is rearranged again. In 2025, Denmark recorded the highest use of AI in the European Union, with 42.0% of enterprises with ten or more employees compared to 20.0% in the Union as a whole, followed by Finland and Sweden.[3] None of them is a large employer of cutting-edge researchers. Who is "ahead" therefore depends on whether education, place of work or diffusion in production is measured.
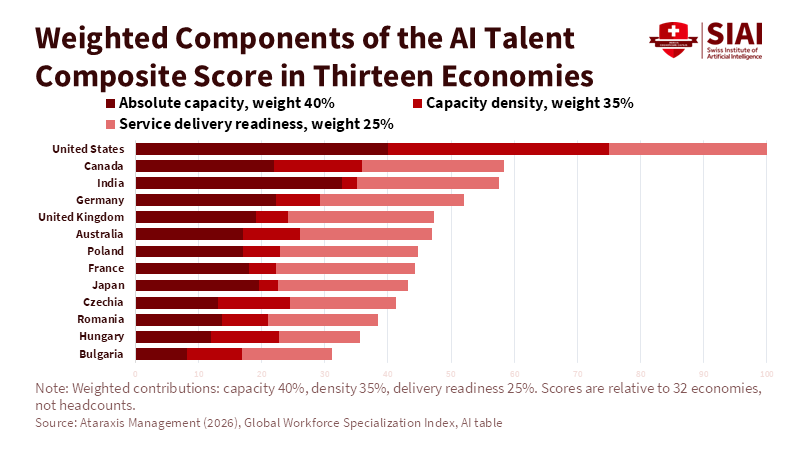
Composite indicators mask this dimension. Ataraxis' Global Workforce Specialization Index, covering 32 countries, gives the U.S. a score of 100 in the AI category, Canada 58.345 and India 57.57, with weightings of 40% for absolute capacity, 35% for density and 25% for service delivery readiness to Western buyers.[4] Such a scale facilitates an outsourcing or location decision, but it does not state that the U.S. has 1.71 times Canada's talent and it does not say anything about China, South Korea, or Singapore, which are absent from the table. The problem is not limited to one indicator. It is about the requirement for a number itself.
The 2023 to 2026 period made the issue pressing for two reasons. The first is technological. Generative models shifted the bottleneck from building models to integrating them into real-world workflows and the economic literature that Ben-Ishai and Thompson summarize for Brookings concludes that exposure does not mean implementation: a task that a model can technically perform is not commercially automated if reliability, completion time and integration costs do not allow it and successful adoption requires the user to judge when an output is reliable.[5] This shifts weight from the few researchers to the many professionals who have to judge when an output is reliable. The second reason is institutional, since within twelve months the U.S. imposed an additional fee on some H-1B applications and converted the lottery to a salary-weighted one, China created a new visa for young scientists and Singapore revised its national strategy. Each measure aims at a different function, usually without declaring it, as Section 5 shows.
The research question is what combinations of education, mobility, employment opportunities and complementary resources enable a country to develop and maintain usable AI capability. The contribution of the paper is to distinguish three national functions, production, hosting and deployment of talent and to construct a matrix of indicators where one country can be strong in one and weak in the other. The first hypothesis is that countries' positions change substantially when measured by place of education, place of work and participation of the applied workforce and it would be weakened by stable relative positions in well-matched measures. The second is that retention is linked to an ecosystem of research opportunities, businesses and resources and not just to the production of graduates. The third is that hosting cutting-edge researchers and the diffusion of AI into domestic businesses are distinct competencies and even a close correlation between them would not indicate the direction of causality. A previous analysis by The Economy argued that retention may matter more to the U.S. lead than the number of graduates produced by its competitors.[6] This position is considered here as a hypothesis, not a given. The paper does not declare a winner and does not attribute causal effects to any policy.
2. Concepts and Literature
Four mechanisms coexist in the literature on talent and are rarely separated in international rankings. Human capital formation is about where skills are acquired, migration is about where people move, accumulation is why they are concentrated in a few cities and businesses and diffusion is whether the technology they produce reaches the companies that do not build it. A country can have a strong education system and export its graduates, or host leading laboratories and have moderate use of AI in its small and medium-sized enterprises. The distinction proposed here assigns the first mechanism to production, the second and third to hosting and the fourth to deployment, without assuming that one function automatically leads to the next.
Economic theory of the migration of highly skilled people has moved away from the simple accounting of "brain drain" for two decades. Docquier and Rapoport's review in the Journal of Economic Literature concluded that the prospect of immigration can increase investment in education in the country of origin, that diaspora reduces transaction costs in trade and investment and that countries that gain are typically large, with a low rate of skilled exodus, while small countries with a high exodus rate tend to lose.[7] Agrawal, Kapur and McHale's empirical work on Indian inventors adds an asymmetry that matters to AI. Access to knowledge through dispersion exists, but it is less than the benefit of physical colocation, so the loss of an innovative researcher is not fully compensated by the ties they maintain with their home country.[8]
Saxenian's study of engineers from Taiwan, India and China who returned from Silicon Valley described the process in terms of circulation, not loss: returnees transferred organizational practices, customer networks and access to capital and set up industries that were connected to the American center rather than competing with it directly.[9] This history explains how a country can train people who work abroad and benefit. It also explains the conditions. The circulation model required open markets, relatively free movement of people and capital and domestic businesses capable of absorbing returnees and when export controls, visa restrictions and geopolitical suspicion drive up the cost of movement, the circulation model is once again approaching a model of permanent location selection, in which the forces of accumulation, the desire of researchers to work where other researchers with access to computing power and data work, favor whoever it already hosts.
Hosting researchers alone does not explain how deeply a technology is used. Comin and Mestieri showed, with data on dozens of technologies over two centuries, that delays in adopting new technologies between countries have decreased, but differences in post-adoption usage intensity have widened and that this second dimension explains much of the income gap.[10] For AI, the question of whether the technology has arrived has already been answered almost everywhere, while the question of how intensively it is used in production remains open. Brynjolfsson, Rock and Syverson explain why: general-purpose technologies require complementary intangible investments in process reorganisation, data and staff training, which are poorly measured and delay the emergence of productivity gains.[11] In the same vein, the study by Svanberg and colleagues on computer vision estimated that, with the integration costs of the time, American companies would find it economically advantageous to automate only 23% of the tasks that the system could technically perform.[12] Talent deployment is therefore not the same as the number of AI experts. It depends on whether there are people within firms who understand both their domain and the limits of the tool well enough to close the gap between technical capability and economic viability.
These distinctions separate four populations that are often grouped in AI workforce measures. Cutting-edge researchers publish at the most selective conferences and construct new methods. AI application engineers adapt, integrate and maintain models in products and systems. Industry professionals who use AI, such as accountants, analysts, legal professionals and healthcare administrators, apply the tools within their own work and the broader workforce includes those affected by AI without using it directly. These populations overlap, but do not add up or substitute for each other as a measure. The size difference is huge. The OECD estimates that about one in three job postings in its countries are for positions with high exposure to AI, while only about 1% of jobs require specialized, complex AI skills.[13] The deployment function depends mainly on the third population, which is the least measured.
The paper focuses on generative AI in cognitive and occupational work and includes cutting-edge research because it shapes the models that are later disseminated. Robotics and predictive systems are left out unless a dataset does not distinguish them, in which case this is noted. Exposure means a technology can affect a task; feasibility means it can meet a specific functional requirement; adoption means it is being used in a certain population over a certain period. Retention is defined as a cohort result: the share of individuals in an initial group who are in the same country after a certain amount of follow-up. A large stock of foreigners working in a country is not a retention rate, as impressive as it may seem.
3. Data and Measurement
The principle underlying measurement is simple and often violated. Each dataset measures a population, with a geographic assignment rule and a reference year and comparisons are made within the same source whenever possible. Measurements that are not harmonized are presented separately, with the year next to each value. A 2022 observation does not become a 2026 observation because it was retrieved in 2026.
For cutting-edge researchers, the key source is the Global AI Talent Tracker 2.0 by MacroPolo, the Paulson Institute's research organization. The sample consists of authors of papers accepted to NeurIPS 2022, when the conference accepted 2,671 papers with an acceptance rate of 25.6%, compared to 1,428 papers and 21.6% in 2019. MacroPolo treats the sample as an indication of the top 20% of AI researchers and the authors of the oral presentations, with an acceptance rate of 1.8%, as an indication of the top 2%. The country of origin is defined by the country of undergraduate studies, not by citizenship or place of birth. One detail of the notes is more important than it seems: the flowchart assigns researchers to the geographic location where they work, while the chart with the countries of work assigns them to the headquarters of the institution and the ranking of institutions is based on a fractional count of authors.[14] A researcher in the London office of an American company can thus be counted as an employee in the UK on one chart and in the U.S. on the other and for large laboratories with multiple locations the choice moves percentage points. MacroPolo's shares are shares of a conference cohort, not national totals. China's 47% does not mean that China trains half of the world's AI workforce.
The AI Index flow indicators measure a different population. The net migration of AI talent is calculated per 10,000 LinkedIn members who declare AI skills or occupations, while the density of researchers and inventors per capita in the 2026 edition is based on Zeki data for 21 countries.[15] These are platform and commercial database populations, with uneven coverage by country. LinkedIn usage in China is limited, so Chinese flows in this metric are underestimated or absent. The 89% drop in researchers and developers moving to the U.S. is not for the NeurIPS cohort and the two measures do not automatically add up or confirm each other.
For the deployment function, official business surveys are the most reliable sources, but they are not comparable to each other. Eurostat annually measures the use of at least one AI technology in companies with ten or more employees and asks firms that considered AI but did not adopt it why they did not.[16] The U.S. Census Bureau's Business Trends and Outlook Survey, hereinafter BTOS, asks every two weeks whether the business used AI in the previous fortnight. In November 2025 the wording changed from using AI "for the production of goods or services" to using it "in any business function" and a Federal Reserve note estimates that around 18% of businesses had adopted AI at the end of 2025.[17] The lower rates recorded by the same survey before the change cannot be linked to the newer rate as a single uptrend. This is a series break. And Eurostat's 20% resembles BTOS's 18% only superficially, since business populations, reporting periods and questions differ.
The Ataraxis index needs special consideration because it is the latest international ranking to publish AI talent scores by country. Its first dimension, absolute capacity, logs the number of employees based on 10 and normalizes it between the lowest and highest countries in the sample. The second calculates workers per 100,000 inhabitants and normalizes them linearly. The third combines certification portability and market familiarity, based on certification data, the presence of branded vendors and market shares by industry analysts. For the AI category, Ataraxis notes that there is no corresponding ISCO-08 occupation code and that the figures are derived from BCG Top Talent Tracker, MacroPolo's tracker, LinkedIn, Tortoise Global AI Index, GitHub and Kaggle.[18] Underlying figures per country are not published. The logarithmic scale means that a difference of 45 points in the first dimension can correspond to a multiple of the number of employees rather than a ratio of it, while the third dimension assesses a country's orientation towards Western buyers rather than its ability to use AI within its borders. The index is designed to answer an outsourcing or location query and is transparent about its formulas. But it cannot be replicated without the input data, which is why it is kept here as an external comparison, without extending the score to missing countries with incompatible data.
Examination of the index's sources revealed a provenance problem that is worth recording. The link to MacroPolo's tracker leads to a website called "MacroPolo Archive," which identifies itself as an independent research archive and presents a "version 3.0" with 2024 and 2025 conference data. According to it, out of 4,622 researchers, 38% had undergraduate studies in China and China shows a "retention rate" of 11%, down from 16% in 2019.[19] These figures do not agree with the finding of the original version 2.0 that more Chinese-educated researchers are now working in China, the site does not document a relationship with the Paulson Institute and the "retention rate" is not defined as a cohort measure. Its elements are not used in the index matrix. A derivative index inherits the weakness of its weakest input and the provenance check must go all the way to the source.
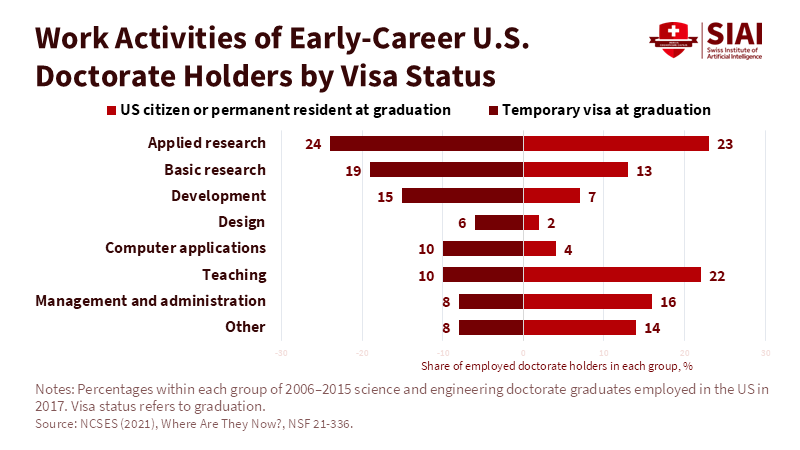
The same goes for retention. When MacroPolo reports that 42% of senior researchers in 2022 were foreigners working in another country, it describes a share at one point in time, not the percentage of an original cohort that remained. An actual cohort measure was identified for only one host country. With data from the National Science Foundation's Survey of Doctorate Recipients, Georgetown's Center for Security and Emerging Technology estimated that about 77% of the more than 178,000 international STEM PhD graduates of American universities from 2000 to 2015 were still living in the U.S. in February 2017, with rates of about 90% for Chinese and 87% for Indian nationals and noted the NSF's warning of possible country-of-origin nonresponse bias in the 2019 survey.[20] This is the format a retention indicator should take: a certain initial group, a certain follow-up interval, a reported loss of observations. For the remaining eleven sampled countries, no comparable series was identified.
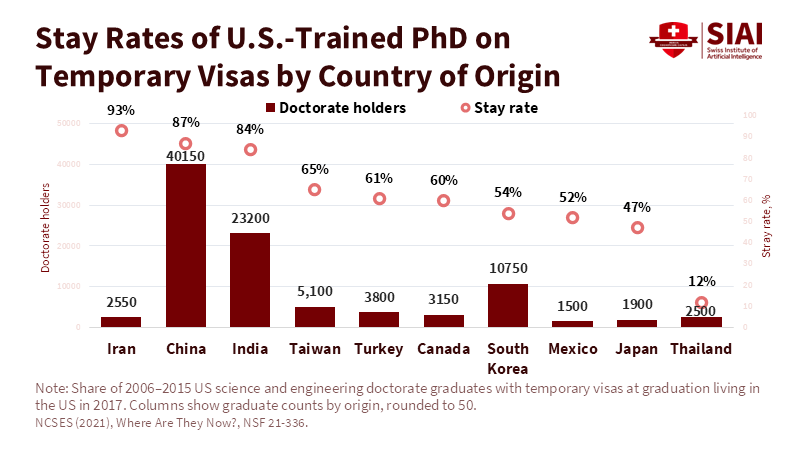
Table 1 summarizes the main measures used to compare national AI capability, their coverage, reference year and principal limitation. The measures capture different populations and functions and should not be treated as interchangeable. Where country coverage differs across sources, the limitation is retained rather than filled with an inferred value.
Table 1. Coverage and Interpretation of National AI Capability Measures
| Measure | Definition | Source / year | Availability | Principal caveat |
|---|---|---|---|---|
| Training origin | Undergraduate study location of sampled top-tier AI researchers | MacroPolo, 2022 | Selected countries/regions | NeurIPS cohort, not national AI workforce |
| Work destination | Current work location of the same researcher cohort | MacroPolo, 2022 | Selected countries/regions | Geographic assignment can differ by workplace vs institution headquarters |
| Research presence | AI researchers and inventors per capita / absolute count | Stanford HAI / Zeki, 2025 | 21 countries | Commercial database population; not equivalent to MacroPolo cohort |
| AI-skill demand | AI job postings as share of all online postings | Stanford HAI / Lightcast, 2025 | Selected economies | Measures employer demand, not actual AI use |
| Enterprise adoption | Enterprises using at least one AI technology | Eurostat, 2025; U.S. Census, 2025–26 | EU countries and U.S. separately | Survey definitions and populations differ across sources |
| Cohort retention | Share of a defined graduate cohort remaining in the host country at follow-up | NCSES/CSET, follow-up 2017 | U.S. only | Not comparable with cross-sectional foreign-worker stocks |
4. Descriptive Evidence: Production, Hosting and Deployment
Comparing place of education and place of work within the NeurIPS cohort is the cleanest test available of the first hypothesis, because both measures come from the same people. In 2022, China was the undergraduate country for 47% of upper-level researchers and the U.S. for 18%, but the U.S. was the place of work for 42% and China for 28%. Within American institutions, researchers with undergraduate studies in the U.S. or China made up 75% of top-level talent, up from 58% in 2019 and the U.S. was home to 60% of leading AI research institutions. India, which in 2019 sent almost all of its researchers abroad, had one-fifth of India-trained researchers working in India in 2022. Overall, the share of foreigners working in another country fell to 42%, thirteen percentage points below 2019.[21] The order of the first two countries is reversed depending on the function and U.S. hosting increasingly relies on two sources of origin, theirs and Chinese, at a time when mobility as a whole is declining.
The AI Index flow indicators point in the same direction for a later period, with a different population. The 89% drop since 2017 in AI researchers and developers moving to the US, with 80% in the last year alone, coexists with a positive net migration of AI professionals to LinkedIn: in 2025 the U.S. recorded a net inflow of 1.22 per 10,000 members and the UK 1.04, while the United Arab Emirates reached 4.4 and Luxembourg ranked first.[22] The two findings are not mutually exclusive. The first concerns the arrivals of a research population, the second the net balance of arrivals and departures between members of a professional networking platform and a country can attract fewer and fewer new researchers while losing even fewer than it already has. The chronology also does not allow the drop to be attributed to the September 2025 $100,000 H-1B payment requirement, since the decrease starts much earlier and the observation window ends in 2025.
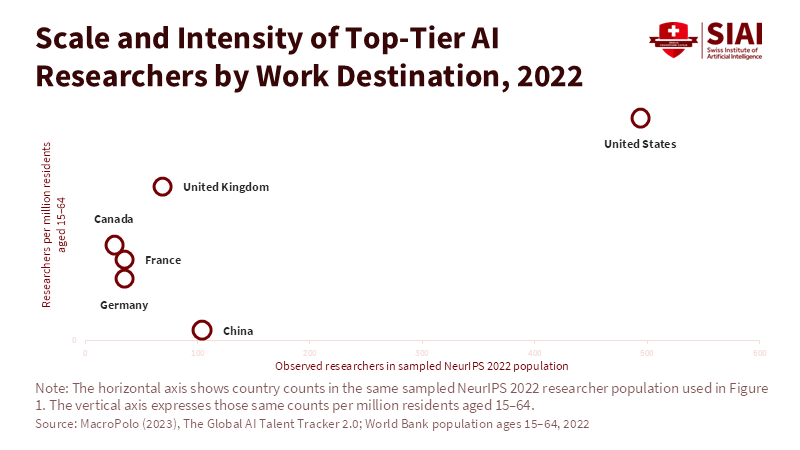
The comparison of scale and intensity brings to the surface a second rearrangement. In Ataraxis' AI category, India scores 81.9 in absolute capability and just 6.6 in density, Canada 54.7 and 39.9, Germany 55.6 and 20.0, France 45.1 and 12.0, Japan 49.1 and 8.6.[23] Ataraxis' own finding that scale and concentration are nearly opposite is more useful than its composite score because it describes a structural fact rather than a ranking. The AI Index 2026 report, with a different population and a different source, comes up with a similar picture: Switzerland has 110.5 AI researchers and inventors per 100,000 inhabitants, Singapore 109.5, Sweden 80.6 and the U.S. 64.8, while Singapore also has the highest share of job postings asking for AI skills, close to 5%.[24] Small hubs can lead in intensity while remaining behind on scale. The choice of denominator carries weight, because the total population includes children and retirees, so countries with different demographic compositions are not compared equally.
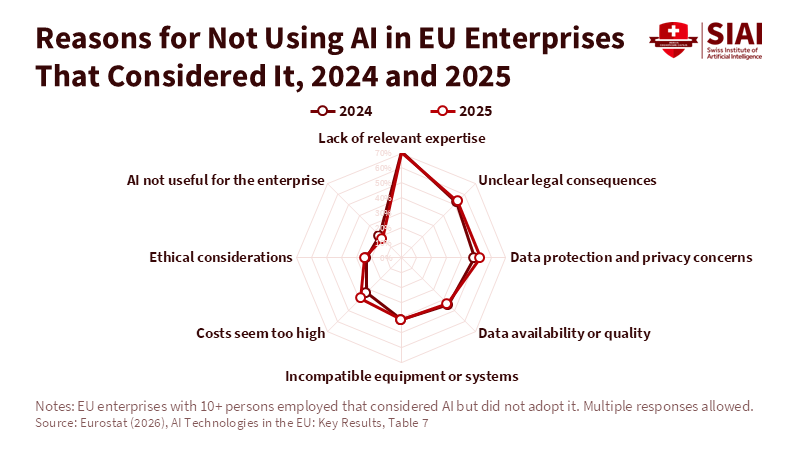
The third function produces the sharpest reordering. In the European Union, the share of businesses with ten or more employees using AI rose from 13.5% in 2024 to 20.0% in 2025. Denmark went from 27.6% to 42.0%, Sweden from 25.1% to 35.0% and Belgium from 24.7% to 34.5%, while at the other end Romania went from 3.1% to 5.2%, Poland from 5.9% to 8.4% and Bulgaria from 6.5% to 8.5%.[25] Germany was in 2025 close to 26.0% and France close to 18.2%, below the European average, although they host much larger AI research potential than Denmark. Among businesses that had considered using AI but did not, the most frequent reason was the lack of relevant expertise, at 70.89%, over ambiguity about the legal consequences, at 52.52%.[26] It points to a shortage of deployment expertise, not frontier research talent. These businesses rarely need NeurIPS writers and almost always need people who can integrate a tool into a process.
Poland offers an additional contrast. In the Ataraxis index, its readiness to provide AI services to Western buyers is rated at 88.0 and Romania's at 70.0,[27] while their domestic companies are at the bottom of the Union in the use of AI. An export stock of skills can coexist with low domestic diffusion when the same engineers work for foreign customers and not for local SMEs. The observation remains descriptive. It does not show that the export of services delays domestic adoption; it only shows that the two dimensions do not have to move together.
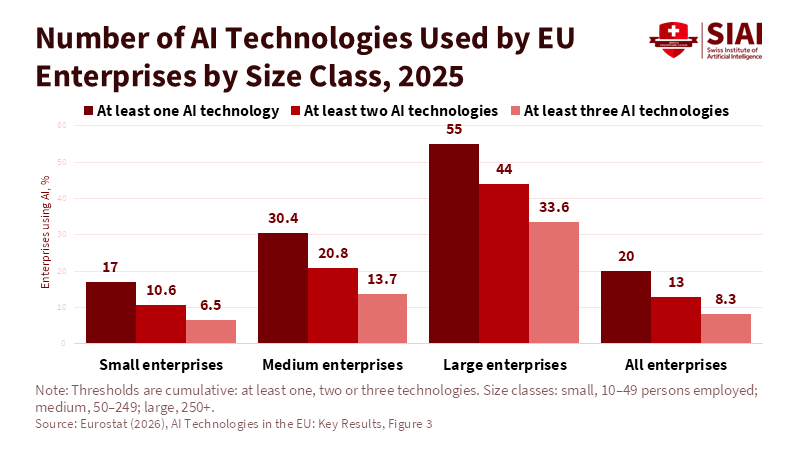
In the US, where diffusion is measured by the national survey, 17% to 20% of businesses used AI between December 2025 and May 2026, but the figure reached 37% in companies with at least 250 employees, 39.7% in the information industry and 33.9% in financial services.[28] The finding raises an important alternative explanation. If the use of AI depends mainly on the size of businesses and the weight of knowledge-intensive services, then differences between countries may reflect their production structure rather than their talent and Denmark would lead because its economy is digitally mature and service-dominated, not because it has more people capable of developing AI. The available data do not rule this out. But it is weakened by the fact that businesses themselves name skills as an obstacle: according to the OECD, around 40% of manufacturing and finance employers who have not adopted AI consider skills to be the main reason, as do more than half of SMEs that do not use generative AI.[29] Structure and skills likely act together and separating them requires enterprise-level data linking staff composition to adoption.
South Korea shows that even the production of innovation does not ensure retention. The AI Index 2026 report ranks it first in the world in AI patents per capita.[30] At the same time, according to a report by the Korea Chamber of Commerce and Industry based on LinkedIn data, the country recorded a net loss of 0.36 AI professionals per 10,000 in 2024 and was 35th among the 38 OECD members,[31] with the US, Canada, Japan and Germany as the main destinations. Other published reproductions of the same data give different values for Korea, which confirms the need to go back to the source before each chart. A country with dense corporate research and large technology conglomerates is losing people. For the second hypothesis, this means that an ecosystem of businesses and diplomas is not enough on its own and that pay, academic career hierarchy and access to computing power may weigh more, but this paper does not test those explanations.
The findings do not all carry the same weight. The first hypothesis is descriptive, since the positions of countries change substantially depending on whether origin, place of work, density or business use is measured and the change occurs within the same source, not just between sources. The evidence is also consistent with the third hypothesis, but it is more fragile, because no source measures the hosting of researchers and business use for the same countries and the same years at the same time: Eurostat does not cover the U.S., China and Singapore and the BTOS does not cover other countries. The result that would weaken it would be a harmonised set of data in which the hosting of cutting-edge researchers and business use move closely together between countries, taking into account the production structure. The second hypothesis remains essentially uncontrolled. The cases of China and India are compatible with it, the case of Korea makes it difficult and no given cohort outside the U.S. allows the ecosystem to be distinguished from wages, language and family choices.
5. Comparative Cases: United States, China and Singapore
The three cases are addressed with the same five questions: where people are trained, how they are hired, whether they stay, what research infrastructure supports them and to what extent AI is used in domestic businesses. The choice of two large systems and a small hub is not intended to set standards and each case involves measures with an uncertain or negative outcome.
The United States remains the largest host of cutting-edge researchers and the largest center of private capital, but the training of its research workforce relies heavily on graduates from abroad and the measures of the last twelve months touch directly on this path. Presidential Proclamation 10973 of September 19, 2025 requires a $100,000 payment for certain H-1B petitions involving workers outside the United States.[32] The Penn Wharton Budget Model estimates that workers abroad account for about 60.5% of registrations.[33] On September 18, 2026, the restriction was extended for another year, through September 21, 2027.[34] As of fiscal year 2027, cap-subject selection is weighted by wage level under the Department of Homeland Security's final rule, published on December 29, 2025 and effective from February 27, 2026.[35] The combination favors applicants with higher salaries and raises the cost for new researchers hired from abroad, i.e., for the population that, according to MacroPolo, is the backbone of American hosting. Retention of those already in the country has been historically high, as the Section 3 cohort data showed and the rule change affects new inputs more than existing inventory. In diffusion, with 17% to 20% of businesses using AI, the U.S. does not stand out based on the available data, although the comparison with Europe is not direct. The profile boils down to very strong hosting, weakened inflow and moderately measured deployment.
China has the reverse profile. It is the largest source of senior researchers in the NeurIPS cohort and its share as a place of work more than doubled between 2019 and 2022. The new mobility instrument does not concern its own graduates, however. Decree No. 814 of the State Council, signed on August 7, 2025, created as of October 1, 2025 the K visa for young foreign scientists and engineers with at least a degree in STEM fields, without requiring a domestic employer or inviting entity.[36] This is a foreign-hosting measure, aimed at strengthening a dimension in which China is less strong and evidence of its implementation was not available by the cut-off date. Research infrastructure is better documented. China leads the world in volume of publications, citations and number of AI patents and the performance gap between the leading U.S. and the leading Chinese model had narrowed to 2.7% in March 2026.[37] For domestic business use, no official series comparable to the Eurostat or BTOS series was identified and the index table records a gap. Published reports of an increase in the return rate of Chinese PhD researchers from abroad could not be linked to a documented cohort and are not used.
Singapore shows what a small hub can and cannot achieve. The second National AI Strategy of December 2023 set a target of tripling the number of AI professionals to 15,000 within five years, with an initial investment of more than S$20 million to train students, expand scholarships and provide access to internships abroad.[38] In January 2026, Singapore committed more than S$1 billion to national AI research and development for the period 2025 to 2030.[39] In February 2026, a National AI Council was established under the Prime Minister and the strategy update published in May 2026 introduced the concept of "bilingual AI talent", i.e. people with expertise in a subject and the ability to apply AI to it.[40] The shift is notable. A country that already leads in researchers per capita and in AI job postings is shifting its planning towards the deployment function, towards the population that Section 2 described as less measured. The weaknesses are equally clear. The public documents reviewed do not mention how many professionals have been added towards the target of 15,000 nor do they publish cohort retention rates, so the achievement of the target cannot be assessed. The scale of the country limits the absolute size of hosting by definition and dependence on foreign professionals exposes it to competition from larger markets and third-party decisions on export controls.
None of the three countries has a single talent policy. The U.S. tightens entry where it is strongest, China opens a new channel for foreign STEM talent and Singapore shifts resources towards diffusion. The measures are not evaluated here as successes or failures, since none has had enough implementation time or results data, but the fact that they rarely state which function they are targeting makes any future evaluation difficult, because without a stated goal there is not a single declared measure of success.
6. Implications and Limitations
For employers, the first conclusion concerns the supply of talent. National talent indicators do not determine the suitability of a supplier or location. Poland's high readiness to provide services says nothing about coordination costs, team continuity or quality control in a particular project and Switzerland's density of researchers does not translate into the availability of application engineering for every business. The second conclusion concerns the type of talent. With only about 1% of positions needing specialized AI skills41 and European companies citing a lack of relevant expertise as the main obstacle42, a company's decision is less often whether to hire a cutting-edge researcher than whether to allow an experienced industry professional to evaluate and integrate AI tools into their work. This distinction should therefore constrain workforce-sourcing decisions.
For universities, the implication is methodological. Institutions know where their students studied and rarely publish where they work five or ten years later. Publishing placement and stay results by cohort and field, with separate records of undergraduate country, citizenship, country of residence and employer location, would convert stocks into retention rates. The fractional count of multiple partnerships and the stated geographic assignment rule should accompany every ranking that institutions invoke in their strategies.
For governments, the implication is that an AI strategy should state which function each measure targets and by which indicator it will be judged. A decrease in researcher inflows is not an indication of weak diffusion and high business use does not compensate for the loss of researchers. For middle powers, the issue is even more practical, since each country has to choose for itself which function to invest in. Measurement is the cheapest first move. A public table with the three functions and cohort retention rates where administrative data is available would make it possible to evaluate measures such as the K visa or Singapore's 15,000 target.
The policy implications depend on the source of the diffusion gap. Whether a diffusion gap warrants public intervention depends on whether it is due to market failure, such as employers' underinvestment in transferable skills, or structural features that do not need to be corrected. A policy that increases national capability can also leave specific groups of workers worse off even without layoffs. The policy on cutting-edge talent and the policy on the broad adaptation of the workforce are not the same program and their results must be assessed separately.
The limits of the paper are specific. The data do not allow causal inferences about the effects of immigration or education policy, since a sample of twelve countries cannot isolate policy from salaries, capital, language and research opportunities and reverse causality is possible, as strong ecosystems attract as much talent as they produce. The observations come from different years: 2022 for MacroPolo and 2024 or 2025 for the rest of the sources and do not form a single 2026 snapshot. Cohort retention rates exist only for the U.S. as the host country and, with reliable analysis by country of origin, only until 2017. Platform indicators underestimate countries with low LinkedIn usage. The first edition is limited to the indicator matrix, the three profiles and the sensitivity checks. An extension with longitudinal researcher data from bibliometric records and administrative sources could calculate retention rates for more countries, but it is a separate research commitment.
7. Conclusion - Measuring National AI Capability by Function
National AI capability is not a stock measured by a number. It consists of the production of people, their hosting and the ability of domestic businesses to use what they build and countries occupy different niches in each. China trains the largest share of top-level researchers, the U.S. hosts the largest share and the highest business use in Europe is recorded in small economies without large cutting-edge labs. South Korea produces innovation and loses people. Small hubs can lead in intensity while remaining behind in scale.
The long-term stake lies in the link between operations, which is weaker than the rankings suggest. A country that keeps its researchers without spreading technology in its businesses will gain laboratories but not necessarily productivity, while a country that deploys AI widely without hosting frontier capability will depend on models and rules that are formed elsewhere. The available data do not yet show which of the two positions is more vulnerable. The practical conclusion is narrow but clear. Each measure of talent policy should state which function it aims at and by which indicator it will be judged and statistical offices should produce cohort retention rates instead of stocks. Without these, comparison between countries will continue to reward whoever chooses to measure their most favorable function.
References
[1, 15, 22, 24, 30, 37] Stanford Institute for Human-Centered Artificial Intelligence (2026) Artificial Intelligence Index Report 2026. Stanford, CA: Stanford University.
[2, 14, 21] MacroPolo (2024) The Global AI Talent Tracker 2.0. Chicago, IL: Paulson Institute.
[3, 25] Eurostat (2025) '20% of EU enterprises use AI technologies', Eurostat News, 11 December. Luxembourg: Eurostat.
[4, 18, 23, 27] Ataraxis Management (2026) Global Workforce Specialization Index. Updated July 2026.
[5] Ben-Ishai, G. and Thompson, N.C. (2026) Workforce Policy for the Age of AI: Recommendations from the Economic Literature. Washington, DC: Brookings Institution, 15 September.
[6] The Economy Editorial Board (2026) 'AI Talent Retention Is Key to America's AI Lead', The Economy Strategy Review, 24 June.
[7] Docquier, F. and Rapoport, H. (2012) 'Globalization, brain drain, and development', Journal of Economic Literature, 50(3), pp. 681-730.
[8] Agrawal, A., Kapur, D. and McHale, J. (2008) 'Brain drain or brain bank? The impact of skilled emigration on poor-country innovation', Journal of Urban Economics, 64(2), pp. 258-269.
[9] Saxenian, A. (2006) The New Argonauts: Regional Advantage in a Global Economy. Cambridge, MA: Harvard University Press.
[10] Comin, D. and Mestieri, M. (2018) 'If technology has arrived everywhere, why has income diverged?', American Economic Journal: Macroeconomics, 10(3), pp. 137-178.
[11] Brynjolfsson, E., Rock, D. and Syverson, C. (2021) 'The productivity J-curve: How intangibles complement general purpose technologies', American Economic Journal: Macroeconomics, 13(1), pp. 333-372.
[12] Svanberg, M.S., Li, W., Fleming, M., Goehring, B.C. and Thompson, N.C. (2024) Beyond AI Exposure: Which Tasks Are Cost-Effective to Automate with Computer Vision? Working paper. Cambridge, MA: MIT FutureTech.
[13, 41] OECD (2025) Bridging the AI Skills Gap: Is Training Keeping Up? Policy brief. Paris: OECD Publishing.
[16, 26, 42] Eurostat (2026) AI Technologies in the EU: Key Results. Luxembourg: Eurostat.
[17] Allen, J.S. (2026) 'Monitoring AI adoption in the US economy', FEDS Notes. Washington, DC: Board of Governors of the Federal Reserve System, 3 April.
[19] MacroPolo Archive (2026) The Global AI Talent Tracker 3.0. Accessed 23 September 2026.
[20] Corrigan, J., Dunham, J. and Zwetsloot, R. (2022) The Long-Term Stay Rates of International STEM PhD Graduates. Washington, DC: Center for Security and Emerging Technology, Georgetown University.
[28] U.S. Census Bureau (2026) 'Large firms with at least 20 employees biggest AI users', America Counts: Stories, 26 May. Washington, DC: U.S. Department of Commerce.
[29] OECD (2026) AI and Skills: What We Know So Far. Paris: OECD Publishing, 5 June.
[31] Korea Chamber of Commerce and Industry, Sustainable Growth Initiative (2025) Economic Impact of Korea's High-Skilled Talent Outflow and Policy Responses. SGI Brief, 18 June. [Korean].
[32] The White House (2025) Restriction on Entry of Certain Nonimmigrant Workers. Presidential Proclamation 10973, 19 September.
[33] Penn Wharton Budget Model (2026) Effects of the New $100,000 Fee and Wage-Weighted Lottery on the H-1B Visa. Philadelphia, PA: University of Pennsylvania, 3 August.
[34] The White House (2026) Restriction on Entry of Certain Nonimmigrant Workers. Presidential Proclamation, 18 September.
[35] U.S. Department of Homeland Security (2025) 'Weighted Selection Process for Registrants and Petitioners Seeking to File Cap-Subject H-1B Petitions', Federal Register, 90 FR 60864, 29 December.
[36] Ministry of Justice, Ministry of Foreign Affairs, Ministry of Public Security and National Immigration Administration of China (2025) Officials Answer Questions on the State Council Decision Amending the Regulations on the Administration of the Entry and Exit of Foreigners. Beijing: National Immigration Administration.
[38] Ministry of Digital Development and Information (2024) Artificial Intelligence Initiatives Launched to Uplift Singapore's Economic Potential. Singapore: MDDI, 1 March.
[39] Ministry of Digital Development and Information (2026) Singapore Invests Over S$1 Billion in National AI Research and Development Plan to Strengthen AI Research Capabilities and Our Position as Global AI Hub. Singapore: MDDI, 24 January.
[40] Ministry of Digital Development and Information (2026) Update to Singapore's National AI Strategy: Refreshed Priorities to Harness AI for the Public Good. Singapore: MDDI, 20 May.