[AI and Workforce] How Firms Build AI Workforce Capability
Published
Keith Lee*
*Swiss Institute of Artificial Intelligence, Chaltenbodenstrasse 26, 8834 Schindellegi, Schwyz, Switzerland

The debate about the adoption of artificial intelligence, hereinafter AI, in companies usually sees it as a tool market. This document treats it as a decision to allocate scarce resources between recruitment, training, staff redeployment, external procurement and AI development, when neither the capabilities of the tool nor the demand for the team's product are known in advance. Official surveys show that companies solve the problem mainly from within: in the European Union, most buy ready-made software and rarely develop it themselves, while in the U.S., AI users trained existing staff ten times more often than hired skilled workers. The paper constructs a 24-month controllable decision model, with sensitivity at 12 and 36 months, in which each entry is labeled as observed, externally estimated or hypothetical and the hours saved only count when absorbed by demand or by physical leaving. Three cases, in customer service, software maintenance and accounting, show that training industry professionals produces the highest modeled contribution when institutional knowledge weighs heavily. The skills gap closes in a few months, that recruitment or external sourcing performs better when the gap is large. Delivery is urgent and that maintaining the existing workflow performs best in short horizons. Under the modeled assumptions, demand volatility improves the relative position of the external provider. The advantage of training is highly dependent on the cost of errors and removing the jobs of new employees improves current finances while creating future expertise costs. Results are scenarios, not causal estimates.
1. Introdution - AI Workforce Strategy as a Capability Investment Problem
In 2025, 20.0% of businesses in the European Union with ten or more employees used at least one AI technology and among those who looked at it without proceeding, the most common reason was the lack of relevant expertise, with 70.3%.[1] In the U.S., in the supplementary questionnaire of the Business Trends and Outlook Survey of the Census Bureau, hereinafter referred to as BTOS, collected from December 2023 to February 2024, 20.8% of businesses using AI had trained their existing staff to use it and just 2.0% had hired staff already trained in AI.[2] The numbers do not show which option is right, but they do show that the practical question for businesses is less about buying the tool and more about sharing learning and control within the team, along with who bears the costs. This is precisely the subject of a workforce strategy for AI and the paper looks at it as an investment problem under uncertainty.
The pressure to make the decision increased from 2023 onwards. Boston Consulting Group's interviews with tech company executives described a leveling of hierarchies and a lack of traditional entry routes for new employees.[3] In 2015 to 2025 resume and job listing data for approximately 62 million employees in 285,000 U.S. companies show that the employment of new employees in companies that adopted generative AI decreased by 7.7% in the six quarters after the first quarter of 2023 compared to the rest, while senior management was not affected.[4] In contrast, Danish administrative data, linked to surveys of 25,000 employees in 2023 and 2024, do not show a significant effect on earnings or hours and users report an average time saving of 2.8% of working hours.[5] The totals remain stable while decisions within companies change and these will determine who gains experience in the coming years.
The prevailing practice treats AI as a technology procurement problem, where the question is which model and under what license. The economic literature summarized by Brookings shows why this is not enough: successful adoption requires the user to know when to trust the outcome and the training needed is specialized by field and practice.[6] A consulting analysis in Forbes formulates the same conclusion as a motto: AI strategy is a workforce strategy.[7] This paper treats the slogan as a hypothesis to be tested, not as a starting point.
The research question is how a company should allocate limited resources between recruitment, training, reallocation, outsourcing and AI development when competencies and demand are uncertain. This decision differs from hiring an AI expert: the expert brings to the team a technical competence that it lacks, while training an industry professional allows it to use and control AI within a job it already knows. The paper contributes a reproducible decision model that links workforce choices to quality, cost and learning requirements and explicitly includes cases where the existing workflow performs best. Four assumptions guide the analysis. The first is that the best sourcing option depends on project expertise, knowledge transfer, demand variability and supervisory capacity and not just wages; it would be weakened by the realization that the relative performance of the alternatives follows almost exclusively the pay gap. The second is that training industry professionals performs best when institutional knowledge counts and the gap can be filled by learning, while recruitment performs better when the gap is large or the delivery is urgent. The third is that removing the jobs of new employees can improve current finances and weaken the future supply of expertise. The fourth is that AI can magnify weak workforce governance by accelerating decentralized decisions on hiring, compensation, evaluation and work allocation and that explainability, reviewability and consistent handling of exceptions affect both the value realized and its distribution.
2. Evidence on Capability Building, Hiring and External Sourcing
The decision to build a business capacity in-house or to buy it has a long theoretical history. According to Williamson, the more specialized an asset is for that particular relationship, the more expensive the transaction in the market becomes, because contracts cannot foresee every eventuality and one party is exposed to the opportunistic behavior of the other.[8] Becker's theory of human capital adds to the distinction between general skills, which are valuable across employers and specialized skills, which are mainly valuable to the current employer, with the provision that firms finance the latter and employees the former.[9] Acemoglu and Pischke showed that in markets where wages are squeezed relative to productivity, firms also finance general training, since they keep part of its performance.[10] For AI, the distinction has practical content. The ability to write instructions in a language model is almost general, while the ability to judge whether a draft compensation settlement respects the terms of a particular insurance policy is deeply specialized.
Empirical research on recruitment provides a benchmark. In personnel data from the investment arm of an American financial firm for the period 2003 to 2009, Bidwell found that external hires were initially paid about 18% more than employees who were promoted to the same positions, had significantly lower ratings for the first two years and left more often.[11] The finding comes from an industry and a business, but the mechanism is general: the external candidate brings measurable qualifications and lacks knowledge of the organization, which is not shown on the resume. Garicano and Rossi-Hansberg describe the organization of knowledge as a hierarchy where the less experienced handle the usual cases and the experienced handle the exceptions, so any technology that cheapens the solution of the usual cases also changes the structure of the group.[12] For the previous generation of information technology, technology paid off when it was accompanied by changes in the organization of work and skilled personnel[13] and these intangible investments are poorly measured, so the gains appear with a delay.[14]
The experimental documentation on generative AI explains why verification is the narrow point. In the gradual introduction of a generative AI assistant to 5,179 customer service employees, in a study published in 2025, productivity, measured as resolved requests per hour, increased by 14% on average and by 34% for novice and less competent employees, with minimal impact on the most experienced.[15] In a 2023 experiment with 758 Boston Consulting Group consultants, AI improved performance on tasks within the limits of its capabilities, but consultants who used it on work outside of these limits were 19 percentage points less likely to give a correct answer.[16] For a business this means that the value of the tool depends on whether someone within the team can recognize where the limits end and that this ability is usually found in experienced industry professionals.
Official business surveys show how businesses acquire AI competence in practice. In 2024, among European companies using AI, 57.9% purchased ready-made commercial software, 28.6% used systems developed or adapted by external providers, 27.0% used open-source software adapted by their own employees, 25.9% used commercial software adapted by their own employees and only 21.8% developed the system on their own.[17] The answers do not add up, since a company can use more than one mode. The difference between the sectors is large: in IT and communications, 41.1% developed a system with their own staff, in construction 11.5% and in tourism and catering 10.2%, while the percentage of ready-made software ranged only from 51.6% to 62.7% in all sectors.
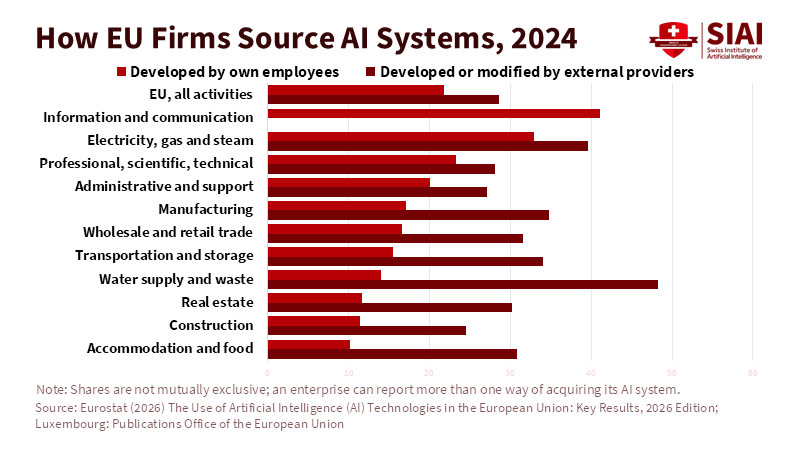
These sectoral differences allow a first test of the Boston Consulting Group's framework, which distinguishes four organizational archetypes, from the "Scaler" that integrates tools into existing flows to the "Reinventor" that resets niche families around AI.[18] The framework is based on interviews with leaders of technology companies and assumes that the business can design its own tools. Outside of IT, where four out of five companies do not develop their own systems, the choice between archetypes becomes a choice between ways of using and controlling tools designed by others and the practical question for a medium-sized business is who will judge the outcomes of a product designed by someone else.
U.S. data also shows what businesses do with their staff when using AI. In the BTOS supplementary questionnaire, 50.5% of users made no changes to how they use AI, 20.8% trained existing staff, 19.7% developed new workflows, 7.8% used external consultants and 2.0% hired staff trained in AI.[19] 94.6% of users said that AI did not change their total employment in the previous six months and for the next six months this percentage fell to 87.4%, with an increase and decrease expected in roughly equal shares. The data are statements, not measurements, relate to AI "in the production of goods or services" with the wording before the November 2025 change and are not linked to the newer series of the same survey.
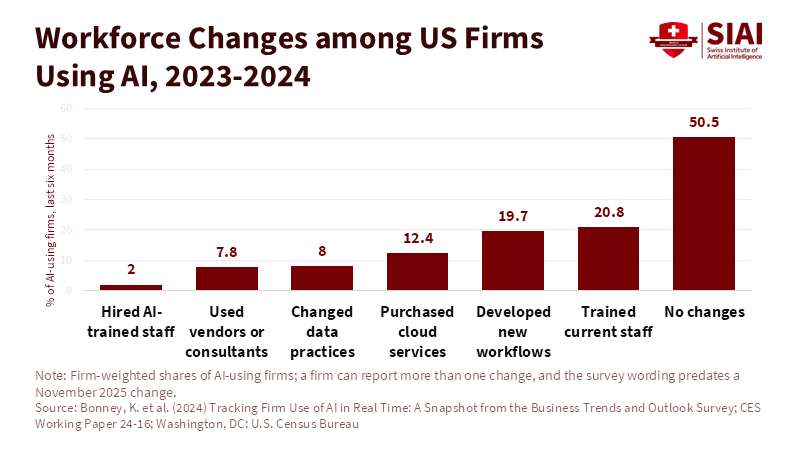
The European and American figures are not comparable to each other. They point in the same direction, however. The typical business buys the technology ready-made, trains those it already employs and rarely changes the composition of its staff in the early stages. This does not prove that training is the right choice; it may simply be the cheapest in the short term or the only one available in markets where specialists are scarce. The model in the next section tries to separate these interpretations.
3. A Decision Model for Enterprise AI Workforce Investment
The unit of analysis is a work group with a certain product, quality requirement and decision horizon, not the business as a whole. One bank may have a team where the recruitment of a specialist is right and another where maintaining the existing flow is correct and a business-level model would hide the difference.
The following definitions are used consistently throughout the analysis. Exposing a job to generative AI only means that the technology can influence it. The model starts one step later, from feasibility, i.e. whether AI meets a certain quality requirement with a certain control cost and ends with adoption, actual use in a certain group and period. In the modeled cases, most uses are forms of augmentation because AI produces intermediate outputs that remain subject to human review. Tool-only deployment comes closest to automation because a larger share of task execution is transferred to the system. The result that the model measures is the operational contribution of the team. Employment, hours, remuneration and quality of work are separate results and the model touches them only through the substitutions that are not made and the entry of new employees.
The model compares seven alternatives, summarized in Table 1. The first is to maintain the existing workflow, which serves as a zero benchmark rather than idleness: it is a choice of its own value, which performs best when all the others have negative modeled contributions. The second is hiring one or more applied AI engineers. The third is the training of existing industry professionals to design, use and control the new flow. The fourth is the reallocation of some employees into roles of workflow managers, replaced by new employees. The fifth is the assignment to an external provider who designs and maintains the solution. The sixth is tool-only deployment without complementary workforce investment. The seventh combines the training of industry professionals with an external provider that undertakes the technical integration in the first months. The first six are mutually exclusive; the seventh is the only combination that is calculated, although others are possible.
Table 1. Alternative Labour Investments for the Introduction of AI
| Alternative | Prerequisites | Months to two-thirds capacity | Main costs | Reversibility | Knowledge retention |
|---|---|---|---|---|---|
| Maintain existing workflow | Current process documented | None | Opportunity cost | Complete | Existing skills retained; AI-control capability may not develop |
| Hire applied AI engineer | Candidates available; domain mentor | About 8 | Recruitment, pay premium, onboarding | Low | Technical knowledge may leave with hire |
| Train domain professionals | Learnable skills gap; protected time | About 5 | Training time, transition output loss, integration | Medium | Verification capability retained internally |
| Redeploy and backfill | Internal managers; backfill budget | About 6 | Backfill pay, training, integration | Medium | Entry-level pipeline can continue |
| External provider | Clear scope; exit terms; internal reviewer | About 3 | Setup and operating fees, review | High if exit terms allow | Workflow knowledge may remain with provider |
| Tool-only deployment | Low error cost; reviewer capacity | About 2 | Licences, review, errors | High | Internal control and learning may weaken |
| Training + external integration | Learnable gap; knowledge-transfer terms | About 4 | Training, output loss, provider fees | Medium | Control retained; technical knowledge depends on transfer |
The decision criterion is the expected discounted operating contribution of the group after the migration costs, compared to maintaining the existing flow. For each month from its first to its last horizon, the template calculates the difference between the value added by the new flow and its operating costs, discounts it at an annual interest rate of 8%, adds it up and subtracts the one-off migration costs. The expected value is obtained as a weighted average of two demand situations: a baseline, where volume remains stable and an unfavorable one, where volume and absorbable hours are halved from the seventh month. In an adverse situation, the external provider and the tool without training can be discontinued, while the salaries of the recruits and the cost of training are not recovered. The base horizon is 24 months, with sensitivities of 12 and 36. Training costs at the beginning and pays off later, external procurement pays off immediately and costs constantly and the loss of new employee entry only costs when today's entry-level employees should have become experienced, i.e. usually outside a two-year horizon, so the choice of horizon can by itself change the order of alternatives.
The value of the new flow is composed of three terms. The first is the value of the hours saved: the hours of control and reprocessing are subtracted from the gross hours and the result is multiplied by an adjustment factor that decreases the greater the share of institutional knowledge and the more external the source of the competence. Net hours only count up to a limit of absorbable hours, i.e. hours that can actually be converted into value, because demand increases or overtime, backlogs and replacements of departing employees decrease. The rule precludes double counting: the same time does not count once as a reduced cost and once as an additional product and an hour left over without use has no value. When cheaper labour expands demand, the threshold rises; when demand is constant, hours are converted into value only at the rate of departures. Danish data, where the savings of around 2.8% did not appear in earnings or hours, show how easily this conversion is lost.[20]
The second condition is the change in the cost of errors. Industry professionals who have been trained to test the tool reduce them, while a tool without trained reviewers increases them because it is applied outside the limits of its capabilities. The hypothesis is based on the experimental findings of Section 2 and the finding that at the end of 2025 the models completed tasks of three to four hours of human work with a success rate of 65%, while the failure rates roughly halve every two and a half years.[21] The third condition is the delay penalty, when the team has committed to a delivery date.
Competence does not appear immediately. Each alternative has a lag, which for recruitment is the search time and for the provider the contract time and a learning constant, the time in which two-thirds of the distance to full capacity is covered. Training can also be capped when part of the gap is not filled by practice, such as when a software maintenance team needs AI engineering skills. Expertise, in the sense of scarce knowledge that allows an employee to generate value that others do not produce, sets this threshold and adjustment factor.[22]
Two constraints accompany the criterion. The quality limitation is expressed through the cost of errors, so that it can be seen how much it costs to violate it. The capacity limitation refers to the hours of experienced reviewers: a percentage of the AI results are assigned to them, divided by an auditability index of the team that is higher for trained industry professionals and hours that exceed the reviewers' free time are paid as overtime. A team with weak control thus pays more for the same amount of results.
Two more limitations can make an alternative unfeasible and not just less attractive. The first is the minimum level of service: in any case the error rate cannot exceed the current one and an alternative that exceeds it is considered unfeasible, even if its value is calculated for comparison. The second is access to data and systems: if customer data is not allowed to leave the business, the external provider is excluded. Delivery deadlines are subject to penalties for delay and these limitations are stated separately for each case.
The last condition concerns the third hypothesis. When an alternative converts hours saved into value by not replacing entry-level employees who are leaving, the template registers a forecast for the future cost of replacing an experienced employee, which takes place in the 30th month. The forecast only appears on the 36-month horizon and this is intentional: it shows how easily a two-year horizon hides costs. Its size is a hypothesis, not an estimate.
The cost components follow a common list: recruitment and onboarding, remuneration and contributions, training time, reduced production during the transition, software and costs of using the model, data preparation and integration, control, errors, switching of provider and staff departures. The latter two are considered sensitivity, because they depend on contract terms and on the labour market. The benefit of additional generation only counts when demand and delivery allow it, through the limit of absorbable hours. The external provider of the cases is domestic; a provider in another country would add costs of coordination, delivery of work, quality control and continuity and country-level talent indicators alone are not sufficient to judge provider suitability.
Each input is marked as observed, externally estimated or hypothetical and the full list, together with the parameters of each alternative in each case and a monthly calculation, can be found in Annex A, so that each number in Section 4 can be reproduced. In the cases of this document all inputs are hypothetical, except for a comparison of the hourly value with Eurostat's hourly labour costs, which is an external estimate. Some have been calibrated in order of magnitude by external estimates, such as the external recruitment bonus,[23] but none are derived from company-specific data. The template is used to organise a decision and to show which inputs judge it; it does not predict results.
4. Worked Cases and Sensitivity Analysis
The same template applies to three recurring enterprise functions, customer service, software maintenance and accounting, in the euro area and in euro. For each case, the volume, working time, quality threshold, remuneration basis, demand and decision maker are declared and the full prices can be found in Annex A. The only observed benchmark is the average hourly labour cost in services, €36.4 in the euro area in 2024.[24] No interviews or business data were used.
Case A concerns the customer service center of a medium-sized insurance company with 20 employees, 4 team leaders and 6,000 cases per month. A language model prepares draft responses for 70% of cases and saves a gross of 630 hours out of 3,000 hours, while review, three minutes per draft and reprocessing require 315 hours. About 2% of cases result in a complaint or compensation, for 18,000 euros per month and the quality limit is not to be increased. Demand is constant, so only 250 hours are absorbed. The hourly value is 27 euros, institutional knowledge corresponds to 60% of the project value per case and the decision is made by the service manager with the finance directorate.
At 24 months, two alternatives yield positive results in relation to maintaining the existing flow, both rely on the training of industry professionals: the combination with external integration yields 82 thousand euros and training with an internal manager yields 80 thousand. In training, usable hours are worth 258 thousand, control and rework cost 138 thousand, error reduction adds 64 thousand, transition costs 89 thousand and operation is 15 thousand; the combination pays less for the transition and more for the operation, due to the provider's fees. The redistribution is at minus 9 thousand, the hiring of an engineer is at minus 163 thousand, mainly due to his salary, the external provider is at minus 174 thousand and the tool without investment in people at minus 101 thousand. The latter two have the highest control costs and increase errors by 10% and 30%, so with the quality limit they are infeasible under the stated quality constraint. At 12 months, no alternative exceeds maintaining the existing flow; at 36 months the training reaches 154 thousand, after a provision of 21 thousand for the entry-level employee who was not hired and the combination is 142 thousand.
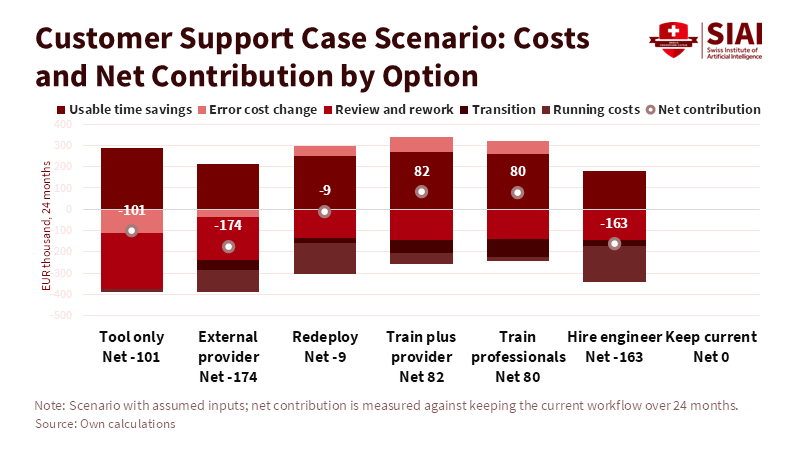
The result is sensitive mainly to the cost of errors and the full sensitivities are listed in Table A1 of the Annex. If the errors do not cost anything, the training drops to 16 thousand and the tool without investment in humans rises to 10 thousand; with 40 free hours of reviewers the tool reaches 21 thousand and exceeds it. The advantage of training therefore comes from the ability to control and the limited time of the reviewers and this is the effect that directly weakens the second hypothesis. The absorbable hours and the success of the training also weigh heavily: with 150 hours the training yields 32 thousand and if it reaches only 70% of the capacity with twice the learning time, about zero. With an hourly value equal to the average cost of Eurostat, the combination rises to 121 thousand compared to 102 for training, because the provider's fees do not follow wages. If the control time is halved every two and a half years, the tool improves to minus 39 thousand, without changing the order.
The sensitivities are combined in three scenarios. The conservative scenario assumes 150 absorbable hours, five minutes of control per draft and half the benefit from errors and the favorable scenario assumes 350 hours, two minutes of control and one and a half times the benefit. In the conservative case, no alternative exceeds the maintenance of the existing flow, with training at zero. In the favorable case, the combination reaches 166 thousand, training 160 thousand and redistribution 60 thousand, while hiring remains at minus 131 thousand.
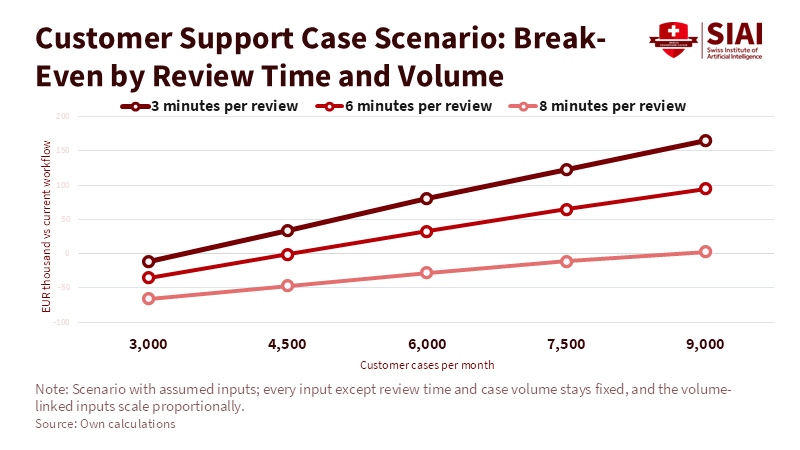
The two inputs that most determine whether training is worth it are the review time of each draft response and the volume of the unit and the equivalence surface varies them at the same time. The volume ranges from 3,000 to 9,000 customer cases per month and the review time ranges from 3 to 8 minutes per draft. Along with the volume, gross hours, reprocessing hours, eligible cases, base error costs and absorbable hours change proportionally. All other cases in case A remain constant: the 70% share of eligible cases and the 30% time reduction, training, integration and leave costs, hour value, cost per error, referral rate and time, 20 free hours of reviewers, discount rate and 24-month horizon. With up to four minutes of control, training performs positively over about 3,400 cases per month and the curve does not change when the control becomes faster because the hours saved already exceed what the unit can absorb. Above this point each additional minute of control moves the limit: about 3,700 cases to 5 minutes, 4,500 to 6, 5,900 to 7 and 8,700 to 8. Control time only starts to matter when it eats up hours that the unit could utilize.
The second case is in a market where recruitment is difficult. In 2024, 20.05% of European companies employed IT specialists, but only 9.55% tried to hire in 2023 and 57.5% of them had difficulty filling positions.[25] 51.87% of large companies tried to hire compared to 6.23% of small ones and 72.62% of large companies trained their staff in IT skills compared to 17.21% of small ones, while in 71.92% of the total IT functions were mainly performed by external suppliers.
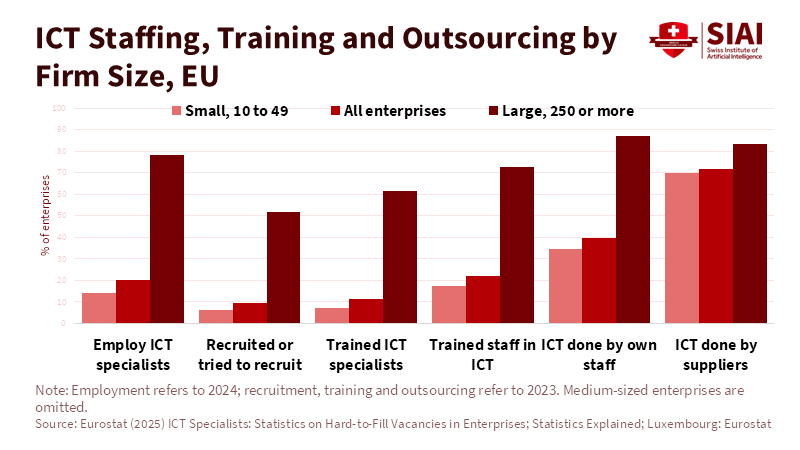
Case B concerns the software maintenance team of an IT services company, with 1,500 requests and 4,500 hours per month. AI saves a gross of 900 hours, of which 600 can be absorbed due to backlogs. The company has committed to operating with AI assistance at 60% of the target by the sixth month, with a penalty of 30,000 euros for each month of delay. The code is standardized, so institutional knowledge weighs only 20%, but developers, even trained, only reach 60% of the required capacity. The hourly rate is 40 euros and the decision is made by the project delivery manager. At 24 months, maintaining the existing flow costs 489 thousand in penalties and 398 thousand in training, while hiring two engineers and using the external provider end up at minus 20 and minus 21 thousand. At 12 months the provider is ahead and at 36 months, hiring, is ahead by 15 versus 2 thousand, because the provider's remuneration continues while the hired ones accumulate knowledge.
The scenario is consistent with the part of the second hypothesis about large gaps and urgent delivery. For the first hypothesis, the picture is mixed. When the specialization of the project is low and the demand is stable, the choice between internal and external sources is judged almost exclusively by the comparison of wages with wages and by the duration of the need, as a simple cost comparison would predict. Specialization and the ability to control change the order of choices when institutional knowledge is an important part of the value, as in the first case.
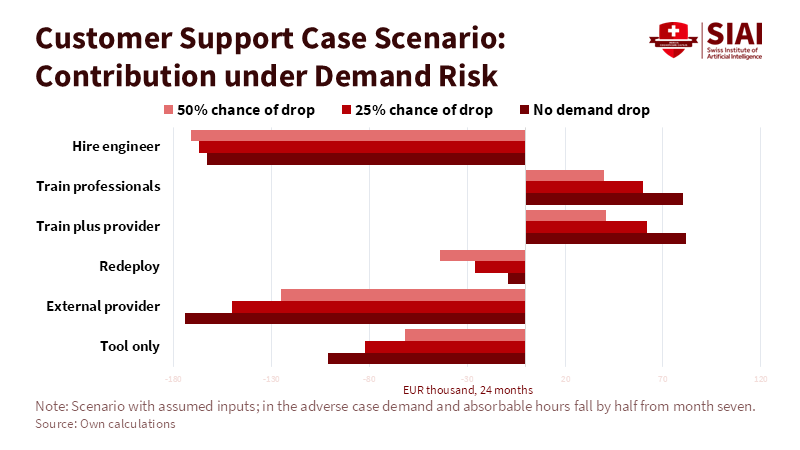
The volatility of demand is checked by the unfavorable situation of Section 3. In case A, with a 25% probability of halving the volume from the seventh month, the combination drops to 62 thousand, the training to 60 thousand and the hiring to minus 167 thousand, while the provider improves to minus 150 thousand, because his contract may expire; with a probability of 50% the prices become 41, 40, minus 171 and minus 125 thousand. The provider gets ahead of hiring even if the exit costs 20,000 euros. Variability shifts the decision to the sources at variable costs, as predicted by the first hypothesis, without overturning the relative advantage of training paths where institutional knowledge weighs heavily.
Case C concerns a small accounting office with 300 client files and 600 hours per month. AI drafts reconciliations of accounts and declarations and saves 120 hours, of which review and reprocessing absorb 100, while partners have only 10 free hours for referrals. Errors cost €6,000 per month, the hourly value is €55 and the decision is made by the managing partner. Hiring a specialist exceeds the budget and the external provider is unfeasible if privacy does not allow the data to leave the office. At 12 months, maintaining the existing flow performs best; at 24 months the training is marginally ahead, with 5 thousand and at 36 months, it reaches 20 thousand, while the tool without training yields minus 77 thousand and increases errors by 40%.
The Commonwealth Bank of Australia provides a practical example of why saved hours cannot automatically be treated as removable labour capacity. In July 2025, the bank announced the elimination of 45 customer-service positions after introducing an AI voice assistant, but reversed the decision the following month after acknowledging that the initial assessment had not captured all operational parameters and that call volumes were rising.[26] The case is limited and journalistically documented, but it illustrates the demand-absorption problem built into the model.
The equivalence point between training and recruitment is considered in a neutral version of the model, with a 40% institutional knowledge share, an engineer hired after three months of search and quickly adapted and a penalty of €25,000 per month if the competence has not reached 60% by the deadline. Two variables change at the same time: the time it takes for industry professionals to learn, from 2 to 18 months and the delivery deadline, from 3 months to none. Training produces the higher modeled contribution at 24 of the 30 points on the grid. Recruitment produces the higher modeled contribution only when learning lasts 12 months and the deadline is 3 or 6 months, or when learning lasts 18 months and there is any deadline up to 12 months.
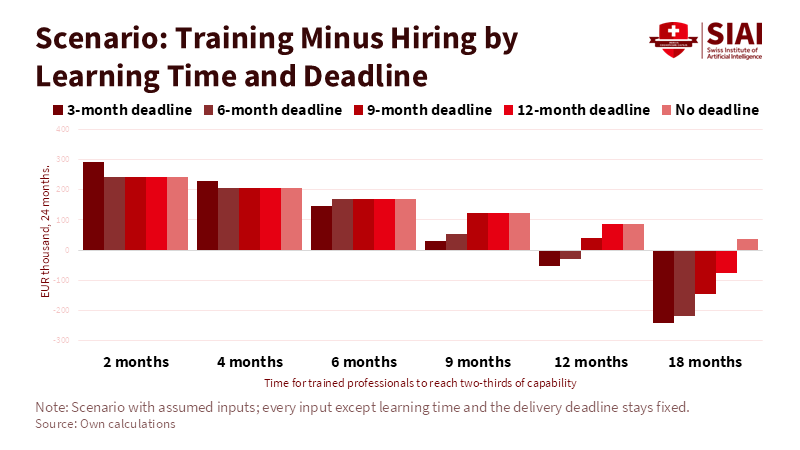
The grid hides a less obvious finding. When the deadline is only three months, equal to the search time, recruitment cannot meet it and the gap in favour of training grows when learning is fast. A shorter deadline than the search time favours the external provider, who can start within a month. The second hypothesis therefore needs a narrower formulation: recruitment performs better when the gap is large and the deadline is after the search time but before the learning time; when the deadline is even closer, recruitment is replaced by external procurement. This rarity is based on the assumption that the recruiter serves a single stream; if he supports several teams, his cost is shared and the range in which recruitment performs better is enlarged.
Each higher-performing option loses its advantage in at least one reasonable condition. In case A, training performs worse than maintaining the existing flow at 12 months and in the conservative scenario, from the combination at 24 months and from the tool when errors are cheap and the reviewers have time; the combination loses at 36 months and with lower pay. In case B, recruitment loses to the provider at 12 months and with volatile demand and the provider performs worse at 36 months. In case C, the existing flow performs marginally worse after the first year. The short horizon favours the existing flow and not the reduction of staff, since the tool without investment in people is not ahead in any horizon. The long horizon is based on the retention of the trained and the relative advantage of training at 36 months withstands 30% of departures per year. The difference between training and the combination, however, is smaller than the error of any entry, so the model justifies a pilot comparison of the two routes and not a definitive choice.
The most serious alternative explanation for all these results is that companies' choices are determined by the size rather than the characteristics of the project. European data support this: large companies use third-party systems in 45.8% of cases compared to 25.8% of small ones and adapt commercial software with their own staff in 41.7% compared with 22.7%[27] If the fixed costs of training and search systematically favour large companies, then the observed preference for training may simply reflect which companies use AI and not which option is better for a given team. The explanation is convincing about the frequency of choices, but it does not explain why internal growth is four times more common in IT than in catering. Separating the two explanations would require enterprise-level data linking size, industry, staff composition and how AI is acquired and such data is not published.
5. Governance, Implementation and Capability Building
The implementation of any of the alternatives should be designed so that the business knows if the decision was right, not just if the tool works. This means that the metrics should be about the inputs that judge the outcome in the model: net hours after verification, the percentage of hours absorbed, the cost of errors, the time to competency and the share of learning tasks left to new employees. An analysis by The Economy on cognitive assignment in the workplace argued that the best outcome does not demonstrate learning and that assessment should test competence without help.[28] The same is true for teams, where the difference between producing more with AI and being able to control it only becomes apparent when the tool fails or changes.
Responsibilities are distributed by function. The human resources department feeds the decision with skills records, mobility, recruitment and learning data and co-manages remuneration, evaluation and exclusions. The operation of the unit is responsible for the efficiency of the workflow, the technicians responsible for assessing the system's capabilities and integration, the finance directorate for checking the actual financial results and the risk and legal officers for the constraints, such as the data privacy of case C. The management resolves the conflicts between current savings and future capacity and retains responsibility for quality and institutional knowledge when tasks move between employees, providers and AI systems.
Table 2 organizes the implementation in four phases over the 24-month horizon. The basic design option is to have a comparison group: one unit or shift that continues with the existing flow for the first few months, while two others test the training with internal and external integration, so that the business can distinguish the effect of AI from seasonal changes in demand. This comparison falls short in validity of a randomized experiment, since the units are not the same. It remains much stronger than the before-and-after comparison without any benchmark.
Table 2. Implementation and Evaluation Plan for Training Pathways in Case A
| Phase | Owner | Baseline | Outcome measures | Review | Stop or redesign if |
|---|---|---|---|---|---|
| Diagnosis, months 1 to 2 | Service manager; finance | Hours, errors, review time | Absorbable hours; error cost; skills record | Month 2 | No absorbable hours or volume below break-even |
| Pilot, months 3 to 6 | Team leaders | Comparison group | Net hours; errors per 100 cases; unaided control test | Month 6 | Errors exceed baseline for two consecutive months |
| Extension, months 7 to 12 | Unit manager | Pilot results | Absorbed hours; reviewer overtime; time to proficiency | Month 12 | Absorbed hours below half the case assumption |
| Stabilization, months 13 to 24 | HR; unit manager | Month 12 results | Net contribution; error trend; unaided entry-level performance | Months 18 and 24 | Unaided performance falls or trained staff are not retained |
The third hypothesis needs special attention because its cost is not shown in any account of the current year. The study of CVs and adverts in the introduction shows that the decline in entry-level employment was mainly due to fewer hires rather than more departures.[29] The estimate of 7.7% comes from the preliminary edition of August 2025; a later version of the same text states about 9%. A theoretical model of the IDE explains why this can be a problem even if overall employment does not change: entry-level employees gain tacit knowledge by working alongside experienced colleagues, complete contracts cannot specify every aspect of knowledge transfer and businesses may automate entry tasks more than would be socially optimal.[30] An analysis by The Economy came to a similar conclusion from ad data: jobs are thinning out before they are lost.[31]
The recommendation for businesses is to treat learning as an explicit product of the team: some tasks that the tool could perform are reserved for entry-level employees, with scrutiny by experienced people and their costs are recorded as an investment. BCG argues that entry pathways should evolve, not disappear.[32] The finding that AI helped beginners in the service center reach experienced ones faster shows that it can also work as a learning tool, but not that beginners gained knowledge that they would retain without it.
Incentives affect whether learning will happen. An experienced employee who is asked to write down the rules and exceptions he knows so that they can be incorporated into a system reduces the scarcity of his own knowledge and if evaluation and remuneration do not recognize this contribution, the rational thing is to share it cautiously. Participation in training depends in the same way on whether new skills change development or remuneration. But incentives create the next problem, that of governance.
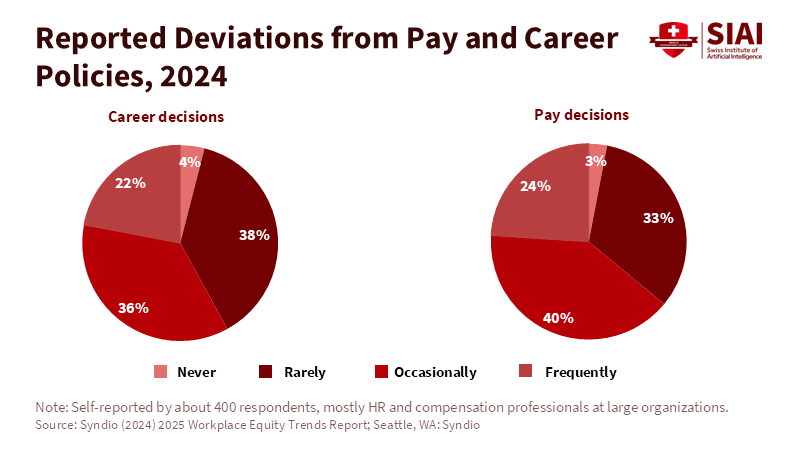
The fourth assumption concerns governance. Workforce decisions are often made in a decentralized manner, with rules that are not always applied. Syndio's Workplace Equity Trends 2025 report, October 2024, is based on a survey of more than 400 professionals, primarily HR and compensation executives, of whom 54% work in organizations with more than 5,000 employees. When asked how often their organization deviates from policies in pay decisions, 24% answered "often," 40% "occasionally," 33% "rarely," and 3% "never"; for development decisions the corresponding percentage was 22%.[33] The report and the Forbes article that use deviations from remuneration policy as an indication that pay governance is gaining weight formulate the finding as divergences between managers and hiring teams,[34] but the question records the assessment of executives rather than observed decisions. The number is self-referential, from a non-representative sample and from a company that sells compensation software, so it only shows that the discrepancies existed before AI.
An example with hypothetical values shows how decisions that stand alone can add up to inconsistency. A company with 200 industry professionals and an average annual salary of €48,000 certifies 40 of them to use AI. As a rule, everyone receives a 5% bonus, with an annual cost of €96,000. Without a rule, managers decide separately, with bonuses of 0%, 5%, 10% and 15% for equal parts of 40 and six employees who receive external offers receive an additional 10% retention increase. The annual cost reaches €172,800, 80% above the rule and the pay difference between employees with the same certification reaches 25 percentage points. Every decision has a reason, but no one sees the sum and if the bonuses are incorporated into the basic salary, the cost is repeated every year. The economic attractiveness of the certification does not ensure that its implementation is manageable.
AI can magnify such discrepancies by increasing the speed and volume of managerial decisions while making inconsistent judgments less visible behind standardized documentation. Mistakes cost more than compensation: In Washington state administrative data for Great Recession layoffs, long-term wage losses were largely due to the destruction of specialized skills,[35] knowledge that is also lost for the business. An analysis by SIAI argued that the ability to govern separates businesses more than access to technology.[36] Table 3 translates this observation into minimal checks on AI-accelerated decisions.
Table 3. Governance Matrix for AI-Powered Workforce Decisions
| Area | AI-related change | Decision owner | Evidence required | Explanation standard | Exception control | Monitored outcome |
|---|---|---|---|---|---|---|
| Recruitment | Automated screening and ranking | Recruiter; HR | Pre-set criteria; tool recommendation; final decision | Rejections tied to stated criteria | Quarterly discard audit; override log | Selection rates; internal-hire share |
| Compensation | Salary and raise proposals | HR lead; remuneration committee | Pay scale; internal comparators | Written justification against pay policy | Approval of deviations; quarterly audit | Share of off-policy decisions |
| Performance | AI-drafted assessments | Supervisor; HR | Documented work examples | Supervisor signs final judgment | Cross-team calibration; employee access to evidence | Score dispersion; objections |
| Work allocation | Automated task assignment | Unit manager | Workload; entry-level learning needs | Written allocation rules | Minimum learning-task share; monthly override check | Learning-task share; unaided performance |
The table distributes responsibilities among different actors within the company. Direct supervisors are responsible for the judgment behind each recruitment, evaluation and assignment, the remuneration committee for exemptions from the remuneration policy and the human resources department for the rules and their consistency. Restructuring and onboarding decisions, which have long-term consequences, are owned by management and controlled by the criteria in Table 2 for absorbed hours and learning tasks. Employees are responsible for reporting when the tool fails.
6. Conditional Decision Rules and Model Limits
The cases imply conditional decision rules rather than a universal preference. Maintaining the existing workflow performs best in short horizons, in the conservative scenario and where verification absorbs almost all gross hours. When institutional knowledge is a large part of value, the skills gap can close within a few months and errors are costly, training industry professionals, with or without external integration, has the highest modeled contribution. Recruitment performs better when the technical gap is large, the need is persistent and the deadline falls between search time and learning time. External sourcing gains ground as the deadline approaches, the project becomes standardized or demand becomes unstable, provided data can leave the business. Redeployment becomes positive only over longer horizons, while tool-only deployment is viable only when errors are cheap and visible and experienced reviewers have time to check referred outputs.
The choice changes when specific information changes and this is what a company must measure before deciding: the actual control time per result, the hours that the unit can absorb, the free time of experienced reviewers, the cost of an error, the learning time observed in the pilot implementation, the terms of exit from a provider's contract and the retention of trainees. The template has not been validated with business data and should not be used as a forecasting tool.
The implications for firms are narrower than the model's full set of possible social consequences. Employees retain value in the redesigned workflow when they can judge where the tool fails and that capacity may require continued opportunities for independent practice. Managers should accompany any estimate of time savings with measured absorbable hours and available reviewer capacity before changing staffing. Firms should also record entry-level learning as an investment and use explicit rules for AI-related skills premiums.
The limits of the paper are specific. Uncertainty is addressed with scenarios, sensitivities and two demand situations rather than full probability distributions, which would require informed assumptions about their distributions and dependencies; the value of flexibility offered by external sourcing is likely underestimated in environments of constant volatility. All case inputs are hypothetical and the results should not be read as estimates for any particular business or industry. The empirical evidence in Section 2 is descriptive, drawn from different countries, periods and formulations and does not allow the choice of training over recruitment to be attributed to any cause. The prediction for the loss of new entry is a numerical value that shows the magnitude of the decision; it does not estimate the future scarcity of experienced employees. The result that would further weaken the third hypothesis would have been data from firms that limited the hiring of entry-level employees after 2023 and did not face a shortage of experienced employees five years later; such data does not yet exist.
7. Conclusion - From AI Adoption to Workforce Investment
A firm's AI decision is therefore also a decision about investment in human capability. In the modeled cases, access to the tool is often cheaper than building the capacity to integrate, verify and govern its output. Official surveys show that most companies buy ready-made systems and train those they already employ, while hiring specialists remains uncommon. The decision model shows the conditions under which that pattern performs well and where it does not. Training industry professionals, alone or with external help for integration, produces the highest modeled contribution when institutional knowledge weighs heavily, the gap closes with practice and errors are costly. Recruitment and external sourcing perform better when the gap is large and time is pressing, while maintaining the existing workflow performs best in short horizons and when demand leaves little room to absorb saved hours.
The most consistent finding concerns the accounting of the decision, not any of the alternatives. The hours a tool saves only have value when absorbed and the advantage of trained teams comes primarily from the errors they avoid, not the time they gain. A two-year horizon also hides the cost of shrinking the entry of entry-level employees, which only occurs when today's entry-level employees should have become tomorrow's experienced reviewers.
In the long run, an economy where every business automates entry tasks and waits to find experienced ones in the market will find fewer experienced ones. It remains open how quickly the models will be improved so that they need less control and whether this improvement will prevent the supply of experienced reviewers from shrinking. The practical conclusion for businesses is narrow: no staffing decision should be based on saving hours without measured absorption and any redesign of positions should state which learning tasks are maintained for entry-level employees and by what indicator their proficiency will be checked.
Annex A. Reproducibility Notes
The template shall be calculated month-by-month and all flows shall be in euros per month before discounting. The capacity of the group shall be zero until the end of the lag and shall then be equal to the learning cap multiplied by the difference of the unit by the exponential function of the negative ratio of the months after the lag to the learning constant. The adjustment factor shall be equal to the unit minus the loss of adjustment of the alternative by the share of institutional knowledge. The hours of review and reprocessing shall be equal to their sum divided by the control capacity index. The value of the usable hours shall be equal to the capacity multiplied by the lesser of the gross hours multiplied by the adjustment factor and the sum of absorbable hours and hours of control, multiplied by the hour value; the review cost is equal to the capacity multiplied by the hours of control multiplied by the hour value and the difference between the two never exceeds the absorbable hours, so that no hour is counted twice. The change in the error cost is equal to the capacity multiplied by the error change in full capacity multiplied by the monthly error cost of the base. The required reviewer hours are equal to the capacity multiplied by the eligible cases multiplied by the referral rate divided by the auditability index by the time per referral; those in excess of the free reviewer hours are paid at the overtime rate. The amounts are discounted monthly at an annual rate of 8% and the one-off costs are charged in the first month. In the unfavourable demand situation, the volume and absorbable hours are halved from the seventh month and the interruptible alternatives then cease to produce benefit and cost. All the inputs in the following tables are hypothetical.
Annex Table A0. Case Inputs
| Input by case | A, Customer Service | B, Software Maintenance | C, Accounting | Neutral version |
|---|---|---|---|---|
| Volume and base hours per month | 6,000 cases, 3,000 hours | 1,500 requests, 4,500 hours | 300 files, 600 hours | Not defined |
| Gross hours saved per month | 630 | 900 | 120 | 800 |
| Hours of review and reprocessing | 210 and 105 | 150 and 90 | 70 and 30 | 120 and 80 |
| Absorbable hours per month | 250 | 600 | 60 | 500 |
| Hourly value | 27 euros | 40 euros | 55 euros | 40 euros |
| Share of institutional knowledge | 60% | 20% | 70% | 40% |
| Quality limit | No increase in errors | 60% capacity by month 6 | No increase in errors | 60% capacity by deadline |
| Monthly cost of base errors | 18,000 euros | Not modelled | 6,000 euros | Not modelled |
| Model licences and costs per month | 720 euros | 1,200 euros | 320 euros | 900 euros |
| Eligible cases, referral rate, time per referral | 4,200; 5%; 6 minutes | Not modelled | 300; 20%; 15 minutes | Not modelled |
| Free reviewer hours and overtime price | 20 hours; 60 euros | Not modelled | 10 hours; 90 euros | Not modelled |
| Delay penalty | None | 30,000 euros per month | None | 25,000 euros per month |
| Forecast for loss of entry-level hiring | 25,000 euros in month 30 | Not applicable | Not applicable | Not applicable |
| Decision owner | Service manager | Project delivery manager | Managing partner | Not defined |
Annex Table A0b. Alternative-Specific Parameters
| Case and alternative | Lag and learning constants | Learning ceiling | Fit loss | Reviewability index | Error change at full capacity | Monthly staff or fee costs | One-time integration, data and migration costs | Entry-level hire not replaced; interruptible |
|---|---|---|---|---|---|---|---|---|
| A, recruitment | 3 and 5 months | 100% | 0.5 | 0.90 | 0% | 8,000 euros from month 4 | 15,000 and 16,000 euros | One; no |
| A, training | 1 and 4 months | 100% | 0 | 1.10 | -20% | €8,000 in months 1 and 2, plus €3,500 in months 1 to 12 | 15,000 and 18,000 euros | One; no |
| A, reallocation | 2 and 4 months | 100% | 0.05 | 1.05 | -15% | 6,400 euros from month 3 | 15,000 and 9,000 euros | None; no |
| A, external provider | 1 and 2 months | 100% | 0.6 | 0.85 | +10% | €12,000 in months 1 to 6, then €4,000 | None | One; yes |
| A, tool-only deployment | 0 and 2 months | 100% | 0.3 | 0.70 | +30% | None | None | One; yes |
| A, training with external integration | 1 and 3 months | 100% | 0.05 | 1.10 | -20% | €8,000 in months 1 and 2; provider fee €9,000 in months 1 to 4, then €1,500 | 0 and 18,000 euros | One; no |
| B, recruitment | 3 and 2 months | 100% | 0.5 | 1.00 | Not modelled | 18,000 euros from month 4 | 20,000 and 36,000 euros | None; no |
| B, training | 1 and 8 months | 60% | 0 | 1.00 | Not modelled | 12,000 euros in months 1 to 4 | 20,000 and 24,000 euros | None; no |
| B, external provider | 1 and 2 months | 100% | 0.6 | 0.90 | Not modelled | €21,000 in months 1 to 6, then €17,500 | None | None; no |
| C, training | 1 and 4 months | 100% | 0 | 1.10 | -10% | 3,000 euros in months 1 and 2 | 8,000 and 9,600 euros | None; no |
| C, external provider | 1 and 2 months | 100% | 0.6 | 0.85 | +16% | 3,000 euros | None | None; no |
| C, tool-only deployment | 0 and 2 months | 100% | 0.3 | 0.70 | +40% | None | None | None; no |
| Neutral, recruitment | 3 and 3 months | 100% | 0.5 | 1.00 | Not modelled | 9,000 euros from month 4 | 15,000 and 18,000 euros | None; no |
| Neutral, training | 1 month and variable | 100% | 0 | 1.00 | Not modelled | 10,000 euros in months 1 to 3 | 15,000 and 15,000 euros | None; no |
The monthly calculation for training in Case A, before discounting, shows how the result is composed. The delivered product stays at 6,000 cases per month in all months because demand is constant and the value of service comes only from the hours utilized.
Annex Table A0c. Monthly Calculation for Training in Case A
| Month | Capacity | Value of usable hours | Review and rework | Error cost change | Licences and model use | Transition staff cost | One-time costs | Net result for month |
|---|---|---|---|---|---|---|---|---|
| 1 | 0% | 0 | 0 | 0 | 0 | -11,500 | -33,000 | -44,500 |
| 2 | 22% | 3.203 | -1,710 | 796 | -720 | -11,500 | 0 | -9,931 |
| 3 | 39% | 5.698 | -3,042 | 1.416 | -720 | -3,500 | 0 | -148 |
| 6 | 71% | 10.333 | -5,517 | 2.569 | -720 | -3,500 | 0 | 3.165 |
| 12 | 94% | 13.556 | -7,238 | 3.370 | -720 | -3,500 | 0 | 5.468 |
| 24 | 100% | 14.436 | -7,707 | 3.589 | -720 | 0 | 0 | 9.597 |
Table A1. Sensitivity of the Net Discounted Contribution in Case A, Thousands of Euros, 24 Months Unless Noted
| Change | Training | Training + external integration | Recruitment | External provider | Tool-only deployment |
|---|---|---|---|---|---|
| Central values | 80 | 82 | -163 | -174 | -101 |
| Zero error cost | 16 | 15 | -163 | -138 | 10 |
| Zero error cost, 40 free reviewer hours | 16 | 15 | -161 | -134 | 21 |
| 10 free reviewer hours | 72 | 73 | -171 | -185 | -114 |
| No free reviewer time | 60 | 61 | -182 | -198 | -128 |
| 150 absorbable hours | 32 | 31 | -163 | -174 | -101 |
| 350 absorbable hours | 125 | 120 | -163 | -174 | -101 |
| Fees minus 20% | 67 | 60 | -139 | -176 | -107 |
| Fees plus 20% | 93 | 104 | -186 | -171 | -96 |
| Hourly value 36.4 euros | 102 | 121 | -204 | -169 | -92 |
| Learning ceiling 70% | 25 | 4 | -163 | -174 | -101 |
| Double learning time | 45 | 54 | -163 | -174 | -101 |
| 70% ceiling and double learning time | 1 | 4 | -163 | -174 | -101 |
| Trainee departures 15% per year | 66 | 68 | -163 | -174 | -101 |
| Trainee departures 30% per year | 53 | 54 | -163 | -174 | -101 |
| Departures 15% per year, 36 months | 134 | 121 | -247 | -253 | -171 |
| Departures 30% per year, 36 months | 114 | 100 | -247 | -253 | -171 |
| Halving review time every 30 months | 80 | 82 | -121 | -123 | -39 |
| Provider fees minus 30% | 80 | 82 | -163 | -133 | -101 |
| Provider fees plus 30% | 80 | 82 | -163 | -214 | -101 |
| Fixed learning of recruit, 12 months | 80 | 82 | -173 | -174 | -101 |
| Discount rate 4% | 87 | 88 | -169 | -179 | -106 |
| Discount rate 12% | 74 | 76 | -157 | -168 | -98 |
Retrieval date of published values: 23 to 25 September 2026. Sensitivity checks performed: conservative, central and favourable scenario; zero error costs, with 20 and 40 free reviewer hours; free reviewer hours of 10 and 0; absorbable hours of 150 and 350; remuneration minus 20% plus 20% and hour value of 36.4 euros; failure of training with a maximum of 70%, double learning time combined; annual trainee departures of 15% and 30%, with a loss of competence equal to a quarter of the percentage and retraining costs of 1,000 euros per replacement; halving the review time every 30 months; provider fees minus plus 30%; exit cost from the provider 20,000 euros; learning constant of the hired 12 months; probability of an unfavourable demand situation of 25% and 50% in cases A and B; discount rate of 4% and 12%; horizons of 12 and 36 months.
References
[1, 17, 27] Eurostat (2026) The Use of Artificial Intelligence (AI) Technologies in the European Union: Key Results, 2026 Edition. Statistical report KS-01-26-009-EN-N. Luxembourg: Publications Office of the European Union.
[2, 19] Bonney, K., Breaux, C., Buffington, C., Dinlersoz, E., Foster, L., Goldschlag, N., Haltiwanger, J., Kroff, Z. and Savage, K. (2024) Tracking Firm Use of AI in Real Time: A Snapshot from the Business Trends and Outlook Survey. CES Working Paper 24-16. Washington, DC: U.S. Census Bureau, Center for Economic Studies.
[3, 18, 32] Bedard, J., Lucero, E., Ebeling, R., Breitling, F., Garcia-Garcia, C. and Sakhuja, A. (2025) AI Is Outpacing Your Workforce Strategy. Are You Ready? Boston, MA: Boston Consulting Group, 15 September.
[4, 29] Hosseini Maasoum, S.M. and Lichtinger, G. (2025) Generative AI as Seniority-Biased Technological Change: Evidence from U.S. Résumé and Job Posting Data. SSRN Working Paper 5425555. Preliminary version, August.
[5, 20] Humlum, A. and Vestergaard, E. (2025) Large Language Models, Small Labor Market Effects. NBER Working Paper 33777. Cambridge, MA: National Bureau of Economic Research.
[6] Ben-Ishai, G. and Thompson, N.C. (2026) Workforce Policy for the Age of AI: Recommendations from the Economic Literature. Washington, DC: Brookings Institution, 15 September.
[7, 34] Colacurcio, M. (2026) ‘AI strategy is workforce strategy, so HR's involvement is vital’, Forbes, Forbes Human Resources Council, 11 June.
[8] Williamson, O.E. (1985) The Economic Institutions of Capitalism: Firms, Markets, Relational Contracting. New York: Free Press.
[9] Becker, G.S. (1964) Human Capital: A Theoretical and Empirical Analysis, with Special Reference to Education. New York: National Bureau of Economic Research.
[10] Acemoglu, D. and Pischke, J.-S. (1998) ‘Why do firms train? Theory and evidence’, Quarterly Journal of Economics, 113(1), pp. 79-119.
[11, 23] Bidwell, M. (2011) ‘Paying more to get less: The effects of external hiring versus internal mobility’, Administrative Science Quarterly, 56(3), pp. 369-407.
[12] Garicano, L. and Rossi-Hansberg, E. (2006) ‘Organization and inequality in a knowledge economy’, Quarterly Journal of Economics, 121(4), pp. 1383-1435.
[13] Bresnahan, T.F., Brynjolfsson, E. and Hitt, L.M. (2002) ‘Information technology, workplace organization, and the demand for skilled labor: Firm-level evidence’, Quarterly Journal of Economics, 117(1), pp. 339-376.
[14] Brynjolfsson, E., Rock, D. and Syverson, C. (2021) ‘The productivity J-curve: How intangibles complement general purpose technologies’, American Economic Journal: Macroeconomics, 13(1), pp. 333-372.
[15] Brynjolfsson, E., Li, D. and Raymond, L.R. (2025) ‘Generative AI at work’, Quarterly Journal of Economics, 140(2), pp. 889-942.
[16] Dell'Acqua, F., McFowland III, E., Mollick, E.R., Lifshitz-Assaf, H., Kellogg, K., Rajendran, S., Krayer, L., Candelon, F. and Lakhani, K.R. (2023) Navigating the Jagged Technological Frontier: Field Experimental Evidence of the Effects of AI on Knowledge Worker Productivity and Quality. Harvard Business School Technology & Operations Management Unit Working Paper 24-013.
[21] Mertens, M., Kuzee, A., Harris, B.S., Lyu, H., Li, W., Rosenfeld, J., Anto, M., Fleming, M. and Thompson, N. (2026) Crashing Waves vs. Rising Tides: Preliminary Findings on AI Automation from Thousands of Worker Evaluations of Labor Market Tasks. arXiv:2604.01363.
[22] Autor, D. and Thompson, N. (2025) Expertise. NBER Working Paper 33941. Cambridge, MA: National Bureau of Economic Research.
[24] Eurostat (2025) ‘EU hourly labour costs ranged from €11 to €55 in 2024’, Eurostat News, 28 March. Luxembourg: Eurostat.
[25] Eurostat (2025) ‘ICT specialists: statistics on hard-to-fill vacancies in enterprises’, Statistics Explained, data extracted June 2025. Luxembourg: Eurostat.
[26] ABC News (2025) ‘Commonwealth Bank backtracks on AI job cuts, apologises for “error” as call volumes rise’, ABC News, 21 August.
[28] The Economy Editorial Board (2026) ‘Cognitive outsourcing at work: Why AI productivity gains are outrunning workplace governance’, The Economy, 26 July.
[30] Ide, E. (2025) Automation, AI, and the Intergenerational Transmission of Knowledge. arXiv:2507.16078, version 7, 16 December.
[31] The Economy Editorial Board (2026) ‘AI productivity gains will thin jobs before they erase them’, The Economy, 1 July.
[33] Syndio (2024) 2025 Workplace Equity Trends Report: Pay Transparency Is Here and Requirements Are Growing. Seattle, WA: Syndio, October.
[35] Lachowska, M., Mas, A. and Woodbury, S.A. (2020) ‘Sources of displaced workers' long-term earnings losses’, American Economic Review, 110(10), pp. 3231-3266.
[36] SIAI Research Editorial (2026) ‘Beyond robot relations: Managing, measuring and organizing the AI-dependent firm’, SIAI Research, 10 August. Schindellegi: Swiss Institute of Artificial Intelligence.