3 types of 'Math Genius', 2 of which will be replaced by AI
Picture
Member for
2 years
Real name
David O'Neill
Bio
Professor of AI/Policy, Gordon School of Business, Swiss Institute of Artificial Intelligence
David O’Neill is a Professor of AI/Policy at the Gordon School of Business, SIAI, based in Switzerland. His work explores the intersection of AI, quantitative finance, and policy-oriented educational design, with particular attention to executive-level and institutional learning frameworks.
In addition to his academic role, he oversees the operational and financial administration of SIAI’s education programs in Europe, contributing to governance, compliance, and the integration of AI methodologies into policy and investment-oriented curricula.
Published
Modified
Mathematical ability differs across cultures, with Western academia emphasizing abstraction over procedural speed
AI is automating routine calculations, making conceptual thinking more valuable than ever
Future professionals must focus on logical reasoning and model formulation to stay relevant
After years of teaching here at SIAI, we have witnessed a varying cultural differences in perception of experts in AI/Data Science in the western hemisphere and in Asia. What was pronounced the most was the concept of mathematics necessary in this particular field. Most Asian students blindly thought that calculation capacity and problem solving skills are emphasized in our curriculum, just by reading the phrases like 'The Most Rigorous MBA in the world'.
We don't.
And we finally understand where the confusion comes from. Here is our scientific analysis of the differences.
Education researchers often distinguish between procedural fluency (being able to execute mathematical procedures quickly and accurately) and conceptual understanding (grasping the underlying principles and structures of mathematics). Many studies indicate that East Asian education systems emphasize procedural fluency, while Western systems, particularly in higher education, prioritize conceptual depth.
Research Backing This View: Studies comparing math education in China, Japan, South Korea, and Western countries (such as the US and UK) consistently show that Asian students outperform in procedural tasks but may struggle with non-standard, open-ended problems requiring deeper conceptual thinking (Ma, 1999; Stigler & Hiebert, 1999).
So, we have formalized 3 types of 'Math Genius', and please note that only the last type is needed at SIAI.
Calculator
Problem Solver
Thinker
Let's go over the dichotomy from our definition of 'Math Genius'.
1.Calculator: Speed and Accuracy as Genius
Mathematical ability is often perceived differently across educational systems. In many East Asian countries, proficiency in mathematics is equated with speed and accuracy in calculations. A student who can quickly solve a quadratic equation or compute complex arithmetic is often considered a math genius. This perception aligns with research by Stigler and Hiebert (1999), which highlights that Asian students tend to excel in procedural fluency due to structured and rigorous mathematical training at an early stage.
However, in higher education, particularly in Western academic institutions, mathematical proficiency is defined differently. The emphasis shifts from speed to logical reasoning, abstract thinking, and the ability to construct mathematical models. Research in mathematics education (Ma, 1999; Li & Collins, 2021) shows that while Asian students tend to perform well in structured mathematical settings, they often face challenges when required to engage in open-ended problem-solving and theoretical abstraction.
2.Problem Solver: Procedural fluency as 'Math Genius'
At the high school level, the focus of mathematics education begins to shift from pure calculation to problem-solving. Advanced mathematics curricula require students to derive solutions from first principles, navigate multi-step logical reasoning, and understand abstract mathematical structures. This transition is critical for success in competitive university entrance exams, as seen in South Korea’s CSAT and similar standardized assessments in other countries.
This is why Asian students excel in competitive math Olympiads, which require both procedural skill and non-standard problem-solving.
As students enter university, particularly in STEM fields, the nature of mathematics evolves further. Research in international mathematics education (Li & Shavelson, 2001) suggests that students who rely primarily on procedural problem-solving may struggle when confronted with theoretical coursework that requires constructing formal proofs and engaging with abstract concepts. This distinction between procedural fluency and conceptual understanding is well-documented in the literature on cognitive development in mathematics (Tall, 2004).
Western academia sees calculation speed as "machine-like" rather than as a sign of intelligence is supported by psychological studies on how different cultures define intelligence.
Expert Perspective: In Western academia, a "math genius" is often equated with someone who can create new mathematical theories, prove complex theorems, or develop novel models—not just someone who is quick at calculations. This is evident in how Western math competitions, graduate exams, and research expectations focus on deep reasoning rather than speed.
Historical Context: The Western concept of a mathematical genius is shaped by figures like Gauss, Euler, and Gödel, who were not just quick calculators but pioneers in abstract reasoning.
3.Thinker: The Role of Mathematical Thinking in AI and Data Science Education
In applied fields such as AI and Data Science, mathematical proficiency takes on yet another dimension. While theoretical knowledge remains essential for foundational research, most practical applications of AI do not require deep engagement with mathematical proofs. Instead, students must understand the conditions under which mathematical models apply and be able to critically evaluate their limitations.
Given this reality, the MBA AI/Big Data program at SIAI has been strategically designed to align with industry needs while accommodating different mathematical backgrounds. Rather than focusing on formal proofs, the curriculum emphasizes:
Understanding Model Assumptions – Students are trained to recognize the conditions under which different AI models (e.g., neural networks, decision trees) are effective and where they may fail.
Applying Mathematics to Business Problems – Instead of proving theorems, the focus is on using mathematical reasoning to optimize decision-making in real-world scenarios.
Bridging Procedural Fluency with Conceptual Thinking – While problem-solving remains an essential skill, students are guided to transition towards abstract thinking where necessary, particularly in courses on machine learning interpretability and data-driven strategy.
This approach aligns with the findings of mathematics education researchers (Schoenfeld, 2007), who argue that effective mathematical training must be contextualized within the problems students are expected to solve in their professional careers.
Why This Matters for Asian Students in STEM Fields
Many Asian students who transition to Western universities for undergraduate or graduate studies in STEM fields often experience a sudden drop in their perceived mathematical ability. This is not because they lack intelligence, but because their definition of mathematical proficiency has been shaped differently.
Studies on international students in STEM (Li & Collins, 2021) show that Asian students often find proof-based courses, abstract algebra, and mathematical modeling more challenging compared to their Western peers, precisely because their training has emphasized computational efficiency rather than abstraction
Students who have excelled in rapid problem-solving often struggle with abstract mathematical thinking. They may find courses in theoretical physics, real analysis, or mathematical finance unexpectedly difficult because the emphasis shifts from computation to proof-based reasoning and conceptual applications.
This is particularly critical for aspiring data scientists. In real-world applications of data science and AI, the ability to logically build models, understand theoretical underpinnings, and translate abstract mathematical ideas into real-world applications is far more valuable than simply applying pre-existing formulas.
Case 1
Let's just come to an example. A Korean student at SIAI tried his dissertation on a set of data from shipping company's use of tools like containers, boxes, baskets, and folklifts. Unless the data is only for a few clients of the shipping company, it was expected that there will be a number of one-time clients whose use of tools will unlikely be repeated in out of sample data. The student, despite learning that RNN can only be applied to time series without non-stationary movements, was not able to link the learned math concept to RNN and the data. He suffered from gradient's divergence, and tried to control the parameters of RNN instead of 'cleaning' the data itself.
Case 2
Addtionally, many Asian students are too busy jumping on code lines rather than accessing the problem set's background description. In the introductory math and stat courses (STA501, STA502, STA503), we emphasize a lot about how important the data generating process (DGP) can be, like whether the e-commerce company's daily visitor data being from matured incumbents like Amazon or a start-up looking for next round funding. Like case 1, your application of RNN can be challenged depending on how actively the company is engaged in promotions. Little differences in question's setting is thoroughly designed by professors as the change requires an entirely different set of data scientific tools. Many Asian students struggle to understand why an Instrumental Variable (IV) has to be replaced just because the start-up's series-C funding is postponed, for instance. If the company does not need a short-term boost in website visitors, reference data points should remove exploding ups and downs for next month's projection, isn't it?
Cases like this occur a lot among Asian students whose course grade is high enough for us to trust their mastery in skills. And unfortunately, they end up poor performance at the dissertation stage.
Then, is it really a necessary skill? Isn't just an application of previous project's code lines good enough?
AI may soon replace first two types of 'Math Genius'
The rise of AI tools like ChatGPT and other advanced language models is further shifting the definition of mathematical proficiency. While traditional education has emphasized procedural fluency and structured problem-solving, AI can now perform these tasks instantly. Routine calculations, algebraic manipulations, and even structured problem-solving techniques are increasingly automated, reducing the necessity for individuals to master these skills manually.
As AI continues to evolve, it is likely that calculator-type mathematicians and even structured problem-solvers will find themselves increasingly displaced. These AI systems can solve equations, optimize parameters, and generate step-by-step solutions for a wide range of mathematical problems more efficiently than humans. This transformation raises a fundamental question: What kind of mathematical thinking remains irreplaceable?
One of the key limitations of AI in mathematics is its reliance on pattern matching. Despite their computational power, AI tools do not “understand” mathematics in the same way humans do. They recognize patterns in vast datasets and generate responses based on probabilistic relationships rather than true logical reasoning or deep abstraction. Mathematical creativity, proof construction, and conceptual modeling remain beyond the reach of AI, as these require forming genuinely novel insights rather than simply retrieving and recombining existing information.
For this reason, the focus of mathematical education should shift toward logical reasoning, model formulation, and critical evaluation of AI-generated outputs. While AI can provide solutions, human expertise is required to assess their correctness, interpret results, and apply them meaningfully within different contexts. In fields such as AI and Data Science, those who master abstract thinking and theoretical modeling will remain indispensable, while those who rely solely on procedural problem-solving may find their skills increasingly redundant.
Conclusion: Redefining Mathematical Proficiency for AI and Data Science
As mathematics continues to evolve as a discipline, educational institutions must adapt their teaching methodologies to prepare students for both theoretical and applied domains. Traditional views of mathematical ability—whether based on calculation speed or structured problem-solving—must be expanded to include logical reasoning, conceptual understanding, and model applicability.
For students entering AI and Data Science, the ability to think abstractly is crucial for research, but applied roles require a balance between problem-solving skills and an understanding of mathematical conditions. By designing curricula that acknowledge these distinctions, our institution ensures that graduates are equipped to excel in both academic and industry settings.
By aligning mathematical training with practical applications, educators can bridge the gap between traditional perceptions of math proficiency and the skills required for success in the modern AI-driven economy.
In short, SIAI teaches most unlikely replaceable data science tools in AI.
Picture
Member for
2 years
Real name
David O'Neill
Bio
Professor of AI/Policy, Gordon School of Business, Swiss Institute of Artificial Intelligence
David O’Neill is a Professor of AI/Policy at the Gordon School of Business, SIAI, based in Switzerland. His work explores the intersection of AI, quantitative finance, and policy-oriented educational design, with particular attention to executive-level and institutional learning frameworks.
In addition to his academic role, he oversees the operational and financial administration of SIAI’s education programs in Europe, contributing to governance, compliance, and the integration of AI methodologies into policy and investment-oriented curricula.
GIAI Admin represents the official administrative voice of the Gordon Institute of Artificial Intelligence (GIAI). This account manages institutional communications, announcements, and operational updates across GIAI’s research, education, and global initiatives.
Input
Previous school: BS in Electronic Engineering, KyungHee University
I took it while working at the company and taking SIAI school classes in parallel. It was a near-death schedule that put me through a hard time, and it taught me a lot. One of my favorite stories says: Go beyond your limits. I was able to gain that experience while working at a company and attending SIAI. I learned that I can achieve greater growth when I push myself to my breaking point. Many SIAI students besides me are having similar experiences. It has been a great asset in my life to be able to meet friends with majors in various fields with whom I can share suffering and grow together as school colleagues, teachers, and friends. I am currently enrolled in SIAI MBA AI/BigData and am about to graduate. While writing my graduation thesis, I learned through SIAI's educational philosophy how to find solutions that only I can create to solve problems.
* Swiss Institute of Artificial Intelligence, Chaltenbodenstrasse 26, 8834 Schindellegi, Schwyz, Switzerland
Abstract
This study aims to improve operational efficiency by optimizing the relocation of Seoul's public bicycles, “ Seoul Bike.” The highlights of the study include Analyzing the usage patterns of Seoul Bike: We analyzed the bicycle travel patterns between business and residential areas, focusing on rush hour.
Introduced the concept of spatiotemporal equilibrium: We proposed the concept of “equilibrium,” where borrowing and returning are balanced in a daily cycle, to provide a basis for relocation strategies.
Developed a data-driven prediction model: We used a SARIMAX model to predict usage by rental location, taking into account variables such as weather, time of day, and location. Optimized relocation strategy: Introduced the D-Index to identify borrowing stations that needed to be relocated, and clustering using the Louvain algorithm to establish efficient relocation zones.
Visualization tool development: We created a visualization tool to intuitively understand bicycle movement patterns and relocation strategies by time of day. This study suggests ways to increase the efficiency of public bicycle operations and improve user satisfaction through a data-driven scientific approach. The results of this study are expected to help Seoul Bike, Seoul reduce operating costs and improve service quality.
This paper will be organized as follows. For the sake of readability, I'm going to divide this article which may seem long and complicated with multiple stories into 5 section.
In the first section, I'll talk about why I became interested in Seoul Bike and the question “Where are the best places to ride Seoul Bike in Seoul?”. In section 2, I would like to talk about the environmental benefits of public bicycle rental in Seoul and what are the biggest problems with this hot item that can solve the health problems of Seoul office workers.
Through this, I will talk about what causes the public bicycle business to always be in the red and analyze the operating costs of the public bicycle industry to lay the groundwork for my thesis topic. In the third section, I will analyze the usage patterns of Seoul Bike from the perspective of users of Seoul Bike in Seoul to lay the groundwork for the core concept of this thesis, equilibrium, which will be discussed in section 4.
In the fourth section, I will discuss specific ideas on how to forecast the usage of each Seoul Bike rental center to solve the deficit of Seoul Bike in Seoul. Finally, we will talk about additional ideas that can maximize the utility of the previous ideas and describe the datasets that can be applied to them.
We'll also talk about the implications of Seoul Bike's work on the Han River bike path and conclude with a discussion of the implications for the future.
Keywords: Seoul Bike, User Patterns, Rental Stations
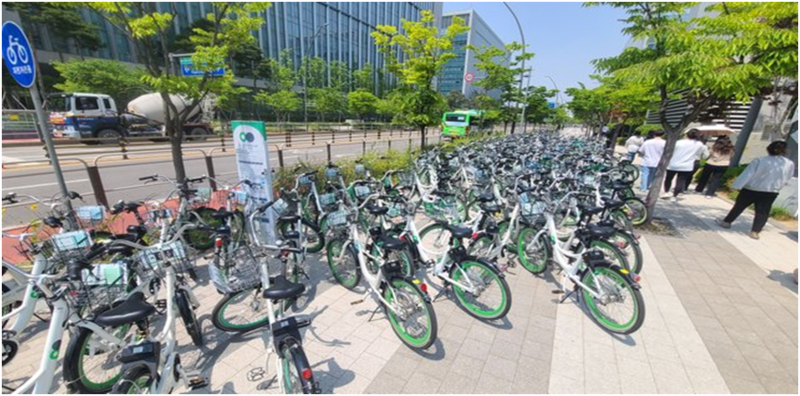
I am a researcher who commutes from Goyang City to my office near Magok Naru Station in Seoul. One day on my way to work, I rubbed my sleepy eyes as I stepped off the shuttle and was surprised to see hundreds of green bicycles.
I usually commute to work on the company shuttle, but I've recently gotten into cycling, and when the weather is nice, I even bike from home to work. The biggest reason I got into cycling is because of the positive image of Seoul Bike, the city's public bicycle program.
The question “Where did all those hundreds of bicycles at Magok intersection on my way to work come from?” [figure 1-1-1] stuck in my mind for a while, and I realized that I could combine my interest in bicycles with my thesis on public bicycle projects.
[Fig.1-1-1] Seoul Bike Station in Magok
1.2. Problem Statement
Seoul Bike, the city's public bicycle program, has grown rapidly since its introduction in 2015, with great support from Seoul citizens. As of 2023, more than 43,000 bicycles were in operation at more than 2,700 rental stations, and the cumulative number of subscribers exceeded 4 million, making it one of the city's most successful policies. This has had a variety of positive effects, including reducing traffic congestion, addressing air pollution, and improving the health of citizens.
But with this rapid growth has come a number of challenges. The city of Seoul runs a deficit of around 10 billion won every year. This is due to low user fees and high operating costs due to the nature of the public service.
There is a shortage or surplus of bicycles in certain time zones and neighborhoods. This causes inconvenience to users and reduces service efficiency. As of 2019, Seoul Bike had only 60 maintenance staff to manage 25,000 bikes, resulting in an increase in broken bikes and poor management of rental stations. Irresponsible use, vandalism, and loss of bikes are causing additional management costs.
1.3. Aims and Objectives
To address these issues, this study aims to develop a demand prediction model for each Seoul Bike rental station: Develop a model that accurately predicts the demand for each bike rental station by time of day and day of the week by utilizing time series analysis and machine learning algorithms. Based on the predicted demand, we optimize the number of bikes at each rental location to solve the problem of demand-supply imbalance.
Reduce unnecessary relocation costs, increase user satisfaction, and improve overall operational efficiency through accurate demand forecasting and optimized deployment. The developed model provides data-driven decision support for critical operational decisions, such as selecting new rental station locations and deciding to purchase additional bikes.
1.4. Summary of Contributions and Achievements
This study aims to improve operational efficiency by optimizing the relocation of Seoul's public bicycles, “Seoul Bike.” The highlights of the study include analyzing the usage patterns of Seoul Bike: We analyzed the bicycle travel patterns between business and residential areas, focusing on rush hour.
Introduced the concept of spatiotemporal equilibrium: We proposed the concept of “equilibrium,” where borrowing and returning are balanced in a daily cycle, to provide a basis for relocation strategies.
Developed a data-driven prediction model: We used a SARIMAX model to predict usage by rental location, taking into account variables such as weather, time of day, and location. Optimized relocation strategy: Introduced the D-Index to identify borrowing stations that needed to be relocated, and clustering using the Louvain algorithm to establish efficient relocation zones.
Visualization tool development: We created a visualization tool to intuitively understand bicycle movement patterns and relocation strategies by time of day.
This study suggests ways to increase the efficiency of public bicycle operations and improve user satisfaction through a data-driven scientific approach. The results of this study are expected to help Seoul Bike, Seoul reduce operating costs and improve service quality.
2. Solution Approach
2.1. Best Place to Ride a Seoul Bike
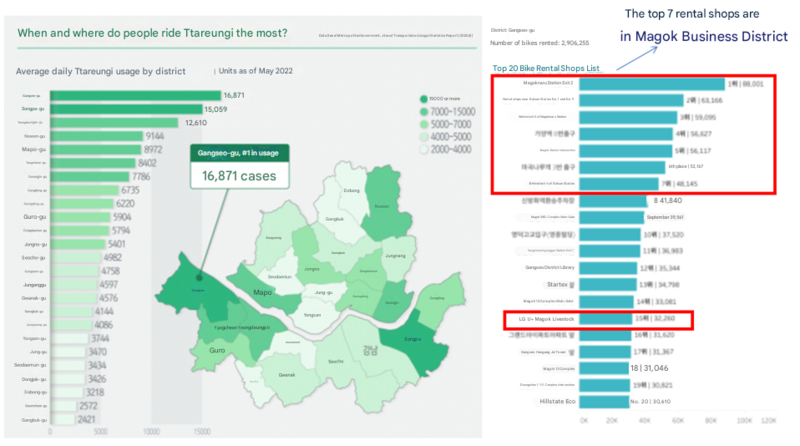
According to the Seoul 2022 Transport Usage Statistics Report, Gangseo-gu is the most populated bike traffic district in Seoul, and within Gangseo-gu, seven locations near the Magok business district ranked among the top.
This is probably due to the nature of the Magok business district. Magok is a large, recently developed business complex with a high concentration of office workers. As a new development, the area is well equipped with infrastructure such as cycle paths. Its proximity to the Han River bike path makes it convenient for both commuting and leisure use.
Bicycle commuting is becoming increasingly popular due to growing environmental and health concerns. On the other hand, Goyang City's public bike "Fifteen" was closed due to losses, showing that it is not easy to ensure profitability in the public bike business. In the case of Seoul Bike, the company runs a deficit of more than 10 billion won every year, so it needs to find ways to operate sustainably.
[Fig.2-1-1] Seoul Bike Station in Magok
2.2. The Cause of The Public Bike Projects' Deficit
The issue of deficits in the public bicycle business and the analysis of relocation costs is a very important topic.
Reducing the cost of relocating bicycles is likely to be the most effective way to reduce the deficit of the public bicycle project. Analyzing the usage patterns of users in Seoul Bike to optimize the relocation of bicycles will contribute to reducing the deficit.
Based on this analysis, it is important to explore efficient operational measures to increase the sustainability of the public bicycle business. Along with establishing specific strategies to reduce relocation costs, it is likely that a variety of approaches will be needed, including engaging users and diversifying revenue.
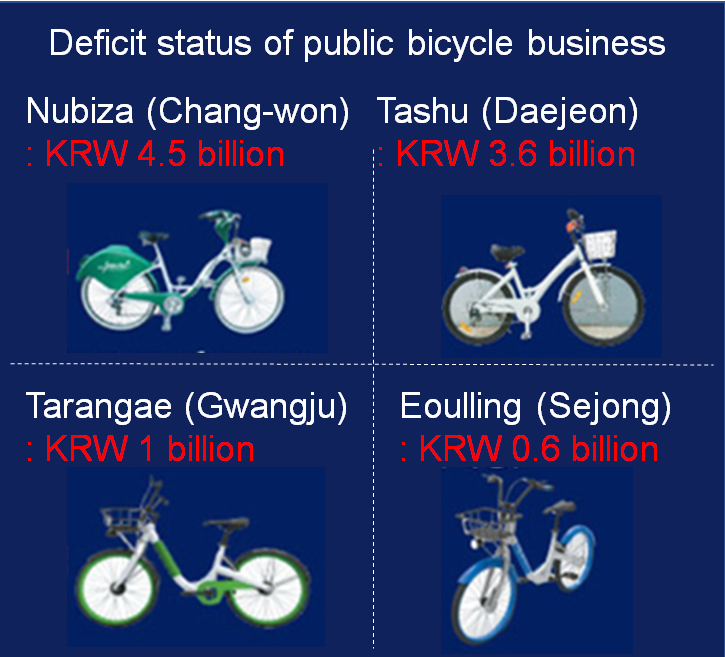
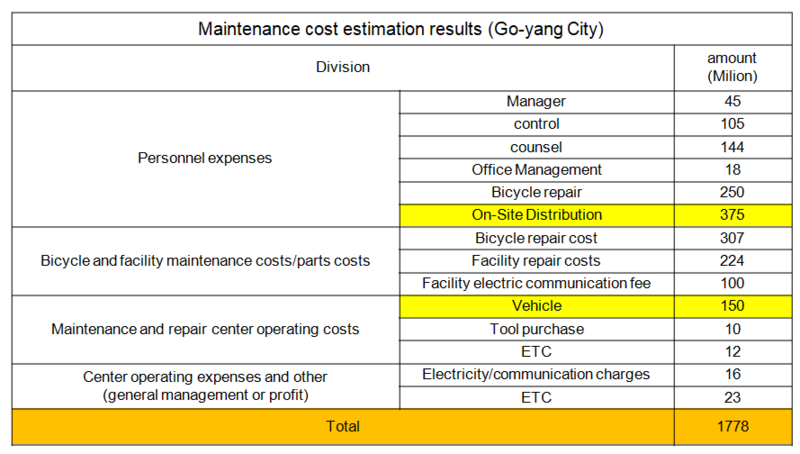
[Fig 2-2-1] Deficit status of public bicycle business Nubiza (Changwo): KRW 4.5 billion, Tashu (Daejeon): KRW 3.6 billion, Tarangae (Gwangju): KRW 1 billion, Eoulling (Sejong): KRW 0.6 billion, Seoul Bike (Seoul): Over KRW 10.3 billion[Fig 2-2-2] Operating cost structure of Go-yang City case The cost of relocating bikes is the largest component, accounting for around 30 per cent of total operating costs. Relocation costs of KRW 525 million, about 30% of total maintenance costs of KRW 1.78 billion. Relocation costs of KRW 525 million: On-site distribution - KRW 375 million, Relocation vehicle operating costs - KRW 150 million
2.3. Time of Day Usage Patterns of Seoul Bike Users
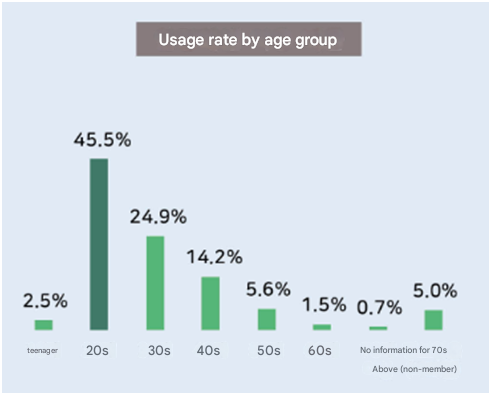
First, let's look at the usage patterns by time of day. On weekdays, the usage is concentrated at 7-8am and 5-6pm, which are commuting hours, suggesting that Seoul Bike is mainly used for commuting. However, on weekends, the usage is relatively evenly distributed from 12 noon to 6 pm, suggesting that it is used for leisure activities or going out. Next, let's look at the user characteristics. In terms of age, users are mainly in their 20s and 30s. This shows that Seoul Bike is becoming a popular means of transport for young people. In addition, the purpose of use is mainly commuting on weekdays and leisure activities on weekends.
[Fig.2-3-1] Seoul Bike Usage Rate by age group
Next, we look at the most important regional clusters. Regional clustering is characterized by a tendency for Seoul Bike to be concentrated in large business districts, areas with well-developed infrastructure such as bike paths, and areas with easy access to the Han River. In particular, it is more popular in areas with easy access to subway stations and workplaces. Representative areas include Magok District in Gangseo-gu, Songpa-gu (Lotte World Tower in Jamsil), Yeongdeungpo-gu (Yeouido business district), and Seongdong-gu .
2.4. Summary
Cycling has become a popular mode of transport for commuting and leisure activities, especially among young people, and tends to be concentrated in large business districts and areas with well-developed cycling infrastructure. These findings suggest that cycling is more than just a mode of transport, but is influencing urban transport systems and lifestyles. Taken together, these findings suggest that cycling policies need to take into account the characteristics of each neighbourhood and focus management and investment on areas with high usage. It is also necessary to consider changes in demand by time of day, with bicycle deployment needing to be adjusted to meet different demands during rush hour and on weekends.
3. Methodology
As we mentioned in Chapter 2, we were able to find out that among the newly developed business districts in Seoul, the business districts where bicycle paths are well-constructed and where access to the Han River bicycle path is easy are the ones where Seoul Bike usage is concentrated.
We will start the analysis by focusing on the super-large business districts that are the cause of the concentration of Seoul Bike usage.
So we have come up with a hypothesis. It is a concept called equilibrium. The idea is that if rentals and returns are equilibrium based on the rental station, there is no need for additional reallocation. To this end, the goal of this paper is to reduce the deficit by improving the efficiency of Seoul Bike reallocation by predicting bicycle rentals and returns.
3.1. Correlation of 24-hour weather data with rental demand
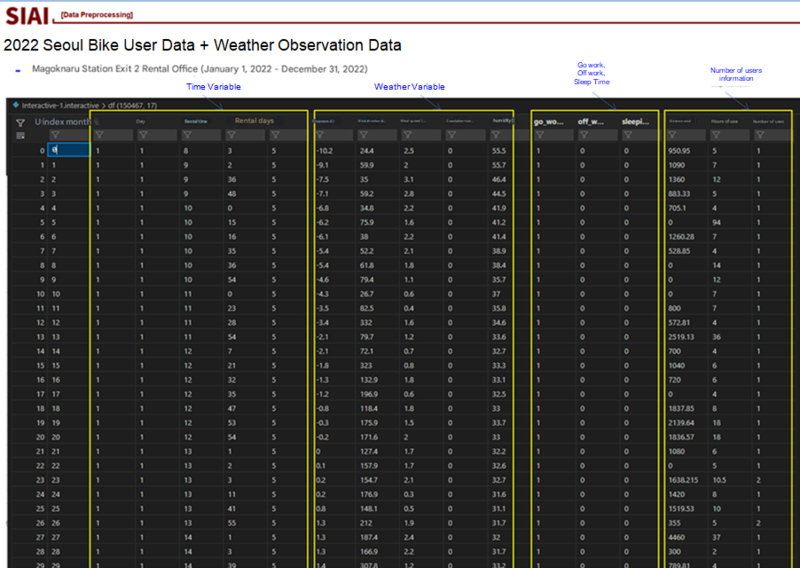
First, in order to confirm the correlation between the Seoul Bike rental data and the weather, pre-processing was performed to integrate Seoul Bike usage information and weather based on the time variable. In addition, in order to identify the phenomenon of rush hour and rush hour, the time was divided as follows.
The preprocessed data below is data from January to December 2022 at the rental office at Exit 2 of Magoknaru Station. From the leftmost column, the time variables are month/day rental time rentals and day of the week, and the weather variables are temperature, wind direction, wind speed, and accumulated precipitation. In addition, Seoul Bike usage information was added to the right column and preprocessed.
[Fig.3-1-1] Seoul Bike User Data + Weather Observation Data
Let's first look at the correlation between the preprocessed data and weather data based on the number of users per minute. First, when looking at the wind speed, the stronger the wind, the more the usage tends to decrease. The highest Seoul Bike usage was at the 3m/s level, which can be felt as a gentle breeze rather than no wind at all.
[Fig.3-1-2] Correlation with Seoul Bike User Data Weather Observation Data
Also, since the accumulated precipitation is inversely proportional to the number of users, it seems to match the general idea that people will not ride bicycles as much as they would use Seoul Bike when it rains. Lastly, the temperature was the highest when people think it is a little cool, around 15~17 degrees, but it was confirmed that the usage was low when it was too cold or too hot.
The correlation with temperature is expected to have seasonality as the Seoul Bike rental volume is correlated with the season. Therefore, we plan to conduct a time series analysis using SARIMAX using external weather variables for the remaining residuals after dividing them into seasonality and trend using STL Decomposition.
3.2. Seoul Bike Daily Return Pattern
In this part, we will analyze the return volume data of Seoul Bike rental stations for 4 years to check the seasonality of the return volume of Seoul Bike rental stations and perform STL Decomposition.
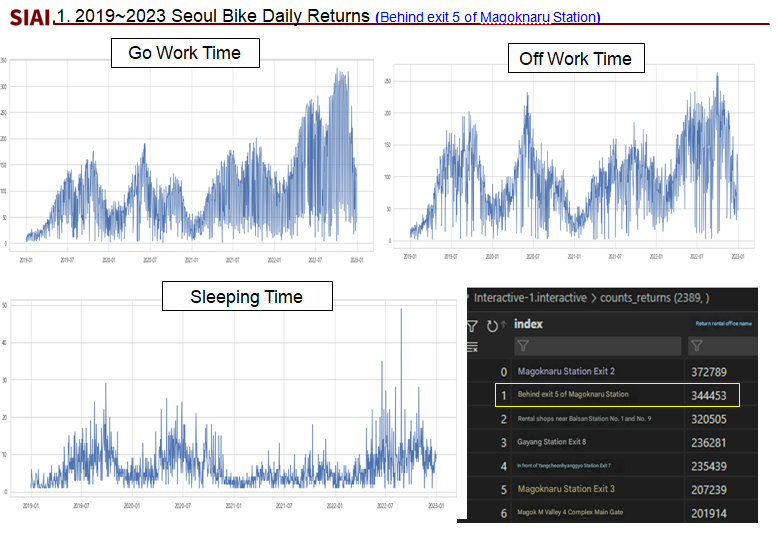
Before conducting a time series analysis to predict the demand for bicycles by Seoul Bike rental station, we drew the daily return volume of Seoul Bike behind Exit 5 of Magoknaru Station from 2019 to 2023. The reason why we did not select Exit 3 of Magoknaru Station, which has the largest number, is because it is a recently built station and there is no data for 19-20 years, so we selected the rental station behind Exit 5 of Magoknaru Station.
We drew a graph of the return and rental during commuting hours of the rental station behind Exit 5 of Magoknaru Station and the cumulative amount, which is the value of the return minus the rental. You can see that the number of bicycles increases as the years go by, and that there is seasonality with the lowest usage in winter and the highest usage in spring and fall.
[Fig.3-2-1] Correlation with Seoul Bike User Data Weather Observation Data
3.3. Modeling of Seoul bike cumulative volume during commuting hours
The number of rentals and returns is symmetrical overall, but you can see that it is biased over time. (There are more returns during commuting hours: returns > rentals)
[Fig.3-3-1] Return and Rent numbers in Go work Time
The cumulative amount representing the number of bicycles in the rental station is expressed as the difference between the number of returns and the number of rentals, and has a trend and seasonality. This means that the use of STL Decomposition, a pre-processing step for time series analysis, is necessary.
The following diagram is a graphical representation of the cumulative amount during go work Time in the business district.
[Fig.3-3-2] Return and Rent numbers in Go work Time
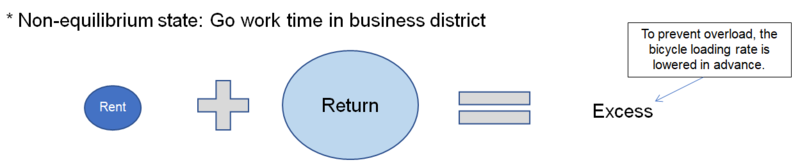
And when you look at the cumulative amount, you can see that the number of returns is a very large proportion compared to the number of rentals, and there is an excess of bicycles.
[Fig.3-3-3] Cumulative number of bicycles during Go work Time
This suggests that the bikes in the business area should be distributed to other areas, leaving only the minimum number of bikes needed in the early morning hours.
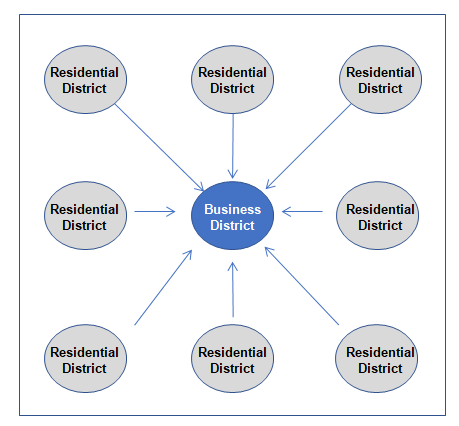
As expected from the graphs above, there is a significant concentration of bikes rented in the morning hours from residential districts to business districts.
This could be a reason to have more racks in business areas than in residential districts.
[Fig.3-3-4] Seoul Bike moving Pattern in Go work time
3.4. Bike Demand Forecasting by using SARIMAX Modeling
3.4.1. Return amount in go work time - STL Decomposition results
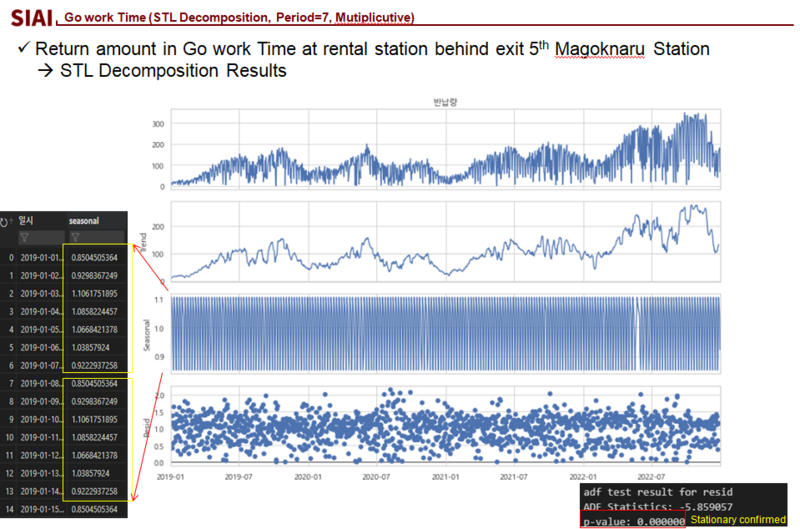
The return amount of the rental office behind Exit 5 of Magok Naru, which we looked at earlier, was decomposed into Seasonal Trend Loess (Local regression). This is the result of extracting the trend and periodicity included in the time series data through STL Decomposition with the period set to 7 days and using the Multiplicative Option.
[Fig.3-4-1] Return amount of Seoul Bike in Go work Time - STL Decomposition Results
We conducted time series analysis using SARIMAX on the residuals from the STL Decomposition discussed above.
We added weather data and time variables and used them as external variables. When we modeled the residuals from the STL Decomposition using SARIMAX, the results are as follows.
[Fig.3-4-2] Return residual of Seoul bike in Go work Time - SARIMAX Results
When the ADF Test was conducted separately, the results showed that stationary was secured, and when looking at the Ljung Box results after running SARIMAX, the P-Value was greater than 0.05, so there was no autocorrelation, and the Heteroskedasticity test results also showed that there was no heteroscedasticity because the P-Value was greater than 0.05. The results when using 90\% of the 4-year return volume data of the rental office behind Exit 5 of Magoknaru Station during rush hour as Train Data and predicting the remaining 10\% are as follows.
When the residuals with secured normality were predicted using the SARIMAX model with the cumulative precipitation and wind direction humidity return years as external variables, it was confirmed that heteroscedasticity was eliminated, and when the return amount was predicted using this modeling, it was confirmed that the R2 value was approximately 0.73.
[Fig.3-4-3] SARIMAX Modeling Block Diagram
3.5. Logic for improving the efficiency of bicycle relocation
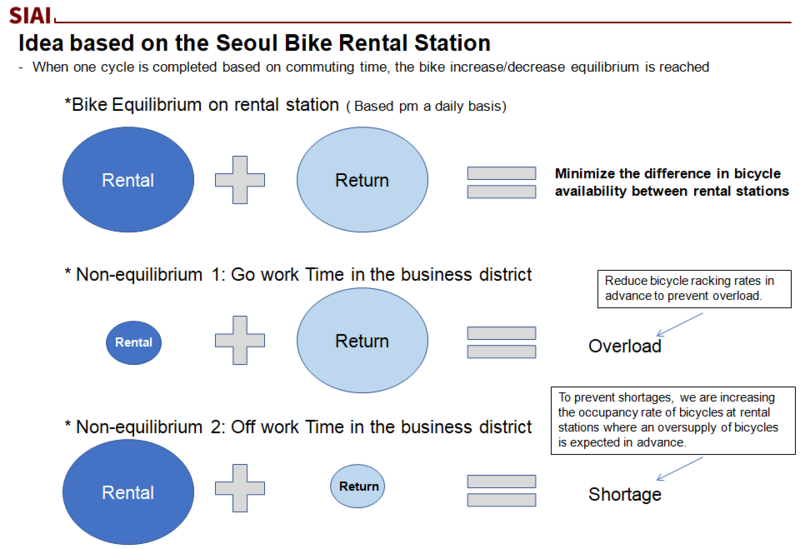
[Fig.3-5-1] Idea based on the Seoul Bike Rental Station
So, the idea that we have thought about based on the Seoul Bike rental stations we have seen so far is the concept of equilibrium. If we group a day into 1 cycle based on commuting hours, it is a concept that a state of equilibrium of bicycle increase and decrease comes. If we summarize it, it can be explained as shown in the figure below.
In addition, the non-equilibrium state is a pattern that can be confirmed by limiting it to the commuting and returning hours of the business area. The non-equilibrium state 1 (commuting hours) where there is an excess of bicycles during the morning commuting hours when returns are the main thing, and the non-equilibrium state 2 (commuting hours) where there is a shortage of bicycles during the afternoon commuting hours when rentals are the main thing can be diagrammed as shown below.
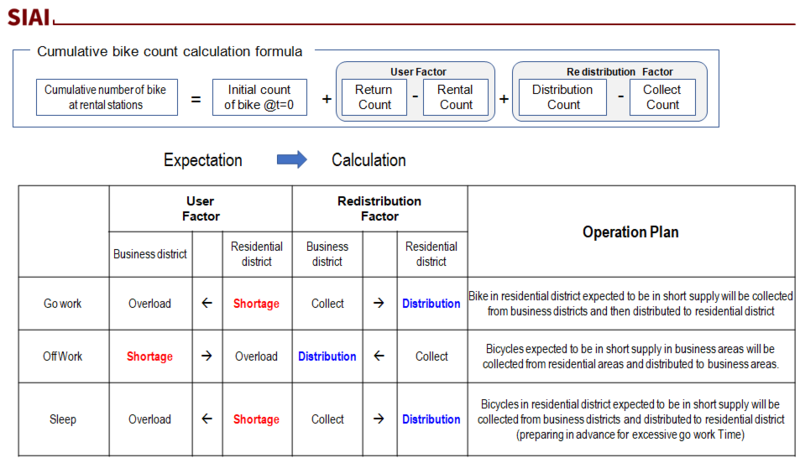
Ultimately, the core logic of this paper is to predict the user factor and determine the optimal redistribution factor in order to resolve the temporal Seoul Bike non-equilibrium of commuting and returning hours.
[Fig.3-5-2] Idea based on the Seoul Bike Rental Station
To summarize the content so far, the areas where Seoul Bike reallocation is most necessary are areas with a large imbalance in bicycle rentals and returns in the super-large business districts where the most rentals and returns occur during commuting hours. (Example: Gang-seo LGSP)
Since people who ride Seoul Bike to work are more likely to ride Seoul Bike home, it would be more efficient to place them only in areas where demand is expected to be excessively high in the afternoon and a shortage is expected, rather than evenly reallocating bicycles that were crowded in the morning by utilizing the equilibrium state.
Also, since a shortage is more likely to cause dissatisfaction with Seoul Bike use than an excess, it is important to predict a shortage rather than an excess, which is the summary of the ideas derived so far.
3.6. Seoul Bike cost efficiency solution according to 1-Day Index Range
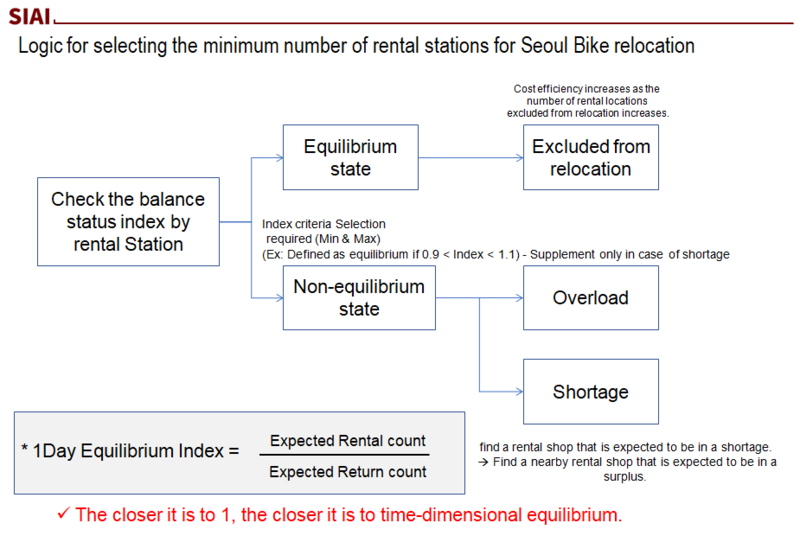
In order to create a logic for selecting the rental stations to be relocated, the 1 Day Seoul Bike equilibrium state Index can be selected as the ratio of the expected rental volume and the expected return volume, and the equilibrium state and non-equilibrium state can be divided.
[Fig.3-6-1] Logic for selecting the minimum number of rental stations
The wider the range of the Index 1 is selected, the more rental stations are excluded from the relocation target, which reduces the cost. In addition, the non-equilibrium state is divided into excess and shortage states, and the relocation is carried out mainly in the shortage state, so that the Seoul Bike bike relocation is carried out in a way that maximizes customer satisfaction.
In order to verify this logic for selecting the rental stations to be relocated to the Seoul Bike, we first looked at the distribution of the Seoul Bike Index and the cumulative amount. The distribution of the D Index and the cumulative number for June 2023 was expressed as a violin plot and histogram.
[Fig.3-6-2] D_Index & Cumulative Number of Seoul Bike for June 2023
The cumulative number, which is the return amount minus the rental amount, mostly had a ratio of 0, and the D Index, which is the ratio of the return amount to the rental amount, had a ratio of 1.
This can be seen as confirming a certain degree of equilibrium between the rental and return amounts of the Seoul Bike mentioned earlier. Therefore, I visualized the efficiency of Seoul Bike reallocation using the temporal equilibrium state through the D Index mentioned earlier.
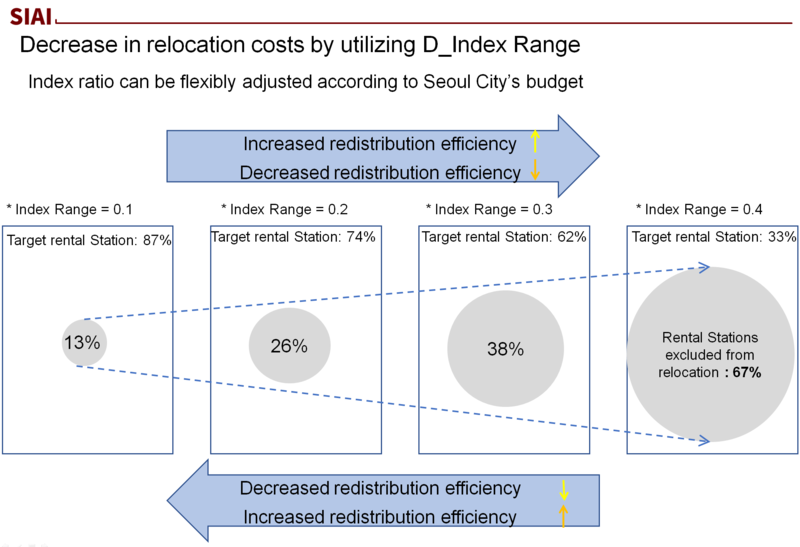
The reduction in Seoul Bike reallocation cost using the D Index Range can be flexibly managed by flexibly adjusting the ratio of the Seoul Bike D Index as shown in the figure below.
[Fig.3-6-3] Decrease in relocation costs by utilizing D_Index Range
As we have seen above, efficient operation is possible by increasing the Index Range excluding relocation and reducing the relocation cost, and it is also possible to operate by flexibly adjusting the Index ratio according to the allocated cost of the Seoul City Seoul Bike budget.
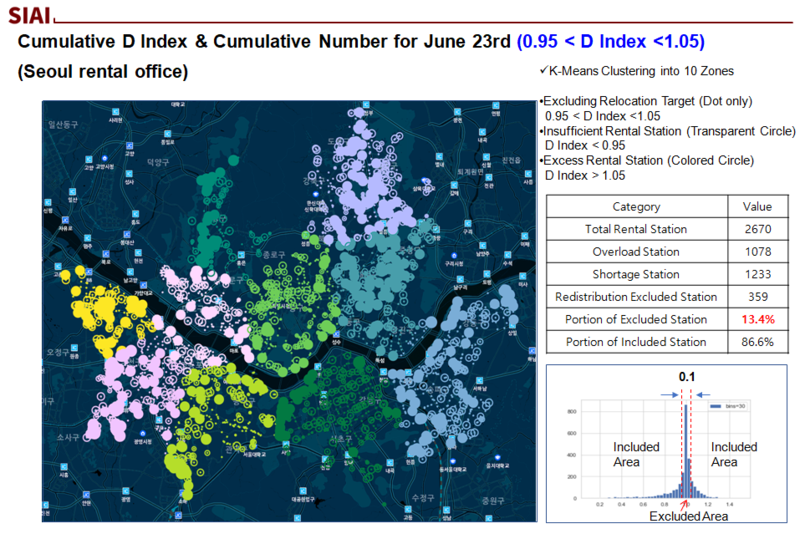
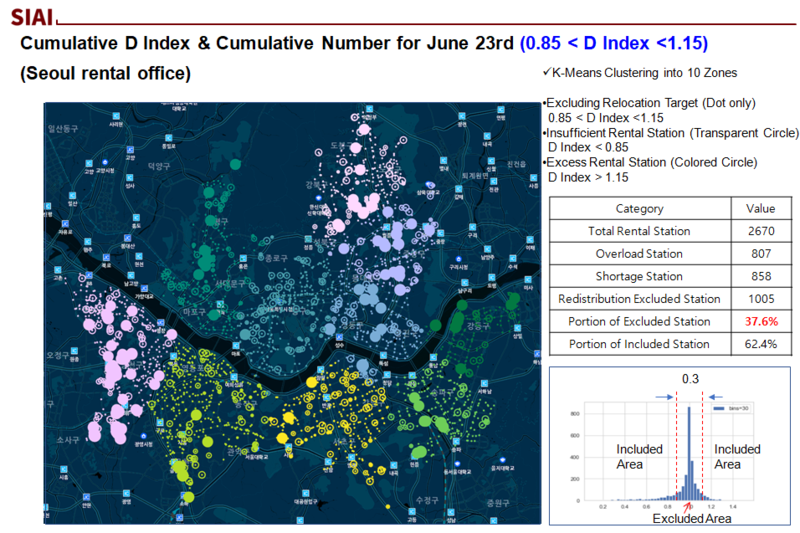
The example presented below is visualized data when the Seoul City operation unit is divided using K-Means Clustering and the D Index Range is flexibly operated from 0.1 to 0.4.
This is the result of diagramming the entire Seoul City using the same method as the Gangseo-gu visualization data confirmed earlier.
In the case of the minimum Index Range excluding relocation target rental stations of 0.1, the ratio of excluded rental stations is 13.4\% and the ratio of target rental stations is 86\%, which is a high ratio. This case will be the most expensive and the relocation efficiency is bound to be low.
[Fig.3-6-4] The ratio of rental station count to relocation according to the D Index Range
In the case where the Index Range for the target rental stations is 0.4, which is the maximum, the ratio of rental stations excluded from the target rental station relocation is 66.6\%, and the ratio of rental stations targeted for relocation is low at 33.4\%.
In this case, the cost of relocation for Seoul bike will be greatly reduced, and the relocation efficiency can also be the highest.
If the ratio of rental stations relocated according to the D Index Range is operated with a focus on practicality, the Index ratio can be flexibly adjusted according to the Seoul Metropolitan Government's Seoul bike budget.
As we have seen above, the ratio of rental stations excluded and rental stations targeted has a trade-off tendency, and the more the ratio of rental stations excluded using the Seoul bike D Index is increased, the fewer bicycles will be targeted for relocation, which can reduce the relocation cost.
3.7. Seoul Bike operation plan idea using spatial equilibrium
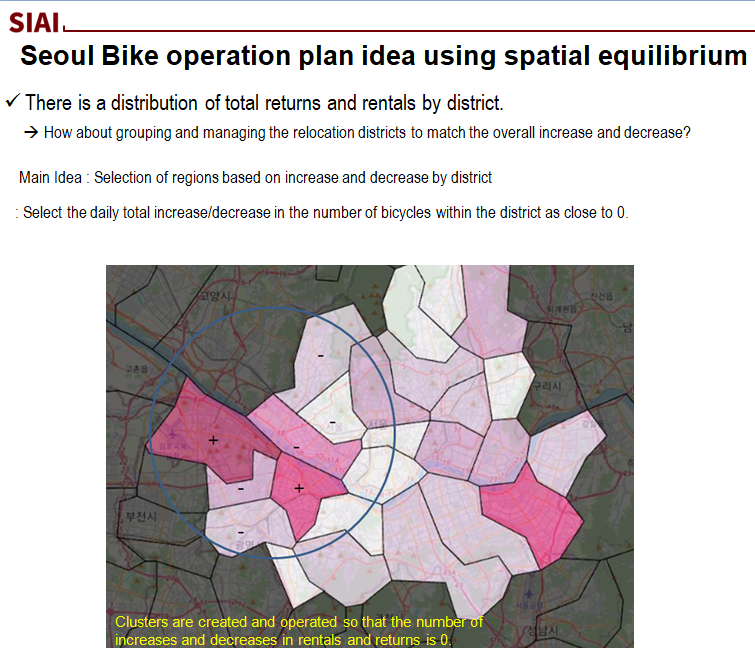
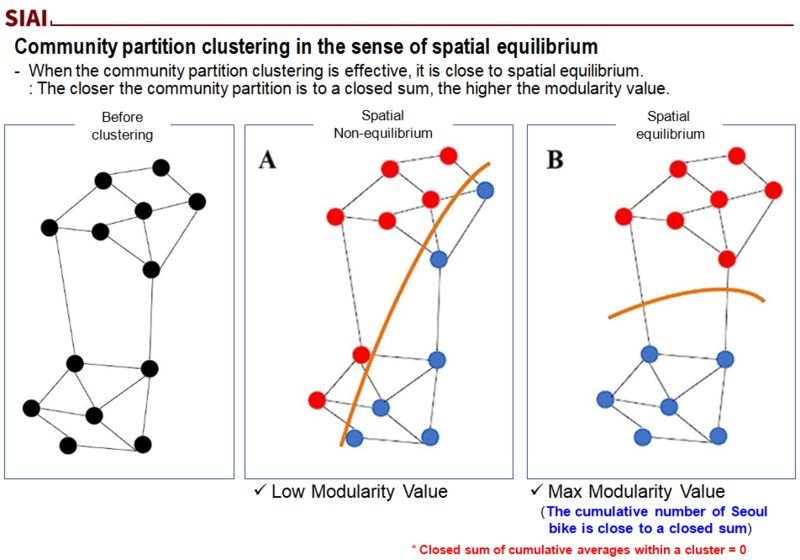
Using the spatial equilibrium examined so far, we have come to think that clustering is necessary to minimize the distance of bicycle redistribution movement by using the distribution of total returns and rentals by district, and clustering that has a partial sum where business districts and residential districts are grouped as a pair.
Since there is a distribution of total returns and rentals by district, we thought about how about managing the redistribution districts by grouping them according to the overall increase and decrease.
Therefore, if the selection of districts according to the increase and decrease by district is selected so that the total daily cumulative number of bicycles within the district is close to 0, there is no need to exchange Seoul Bike between the set districts for redistribution, and the effect of reducing the distance of redistribution bicycles within the district area can be achieved, which leads to improved redistribution efficiency overall because the travel distance of redistribution trucks is reduced.
[Fig.3-7-1] The ratio of rental station bike count to relocation according to the D Index Range
3.7.1. Clustering application idea for implementing spatial equilibrium of Seoul Bike
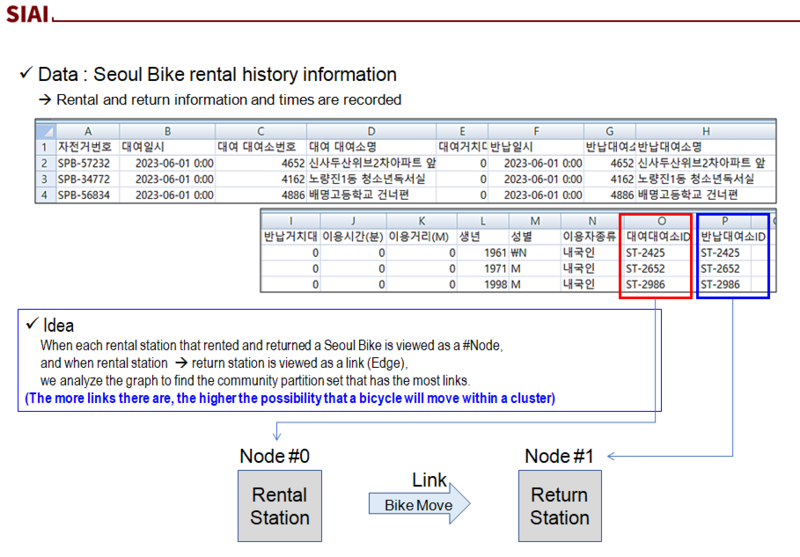
To represent the spatial equilibrium as a mathematical vector, we can think of moving from a rental station node to a return station node as a link.
With this idea, we converted Seoul bike rental information into graph data and then came up with the idea of finding a community partition set with the most links.
[Fig.3-7-2] Network analysis idea for spatial equilibrium analysis of Seoul bikes
3.7.2. What is Network Community Detection?
The problem of dividing a graph into several clusters is called Community Detection.
While thinking about the algorithm to apply to the idea I thought of earlier, I thought about using a cluster detection algorithm that can be used for Seoul Bike movement network data.
The basic concept is that ‘groups with high connection density are tied together’, and the algorithm that calls a group that is tied together and more tightly tied (with high modularity) a Community is defined as Network Community Detection.
[Fig.3-7-4] Community partition clustering in the sense of spatial equilibrium
3.7.3. What is Modularity?
Here, we will learn more about the definition of Modularity, a concept that can quantify the concentration of Network Nodes.
First, the definition of Modularity quantifies the degree to which Nodes are concentrated based on Links in a network structure. The purpose is to measure the structure of a structurally divided network (graph), and the degree of modularity of the network can be expressed as a value of -1 to 1. A value of around 0.3 to 0.7 can be said to indicate a significant cluster.
It can be said to be an Index with a large value when there are many connections within a distinct group within the network and few connections between groups.
The definition of the Index is defined as the ratio of the density of [links within a community] and [links between communities].
For example, a network with high modularity has dense connections between nodes within a module, so the clustering ratio of the same area is high, and the connections between nodes in other modules are sparse, indicating clustering in other areas, which is expressed as a modularity value close to 0.
Modularity
Quantifies the degree to which nodes are clustered based on links in a network structure
Measures the structure of a structurally divided network (graph)
Indicates the degree of modularity of a network with a value of -1 to 1 (significant clustering of 0.3 to 0.7)
A measure that indicates the property that there are many connections within a distinct group in a network and few connections between groups
: Defined as the ratio of the density of [inter-community links] and [inter-community links]
* A network with high modularity has dense connections between nodes within a module (clustering in the same area) but sparse connections between nodes in different modules (clustering in different areas).
3.7.4. Introduction to Louvain Algorithm
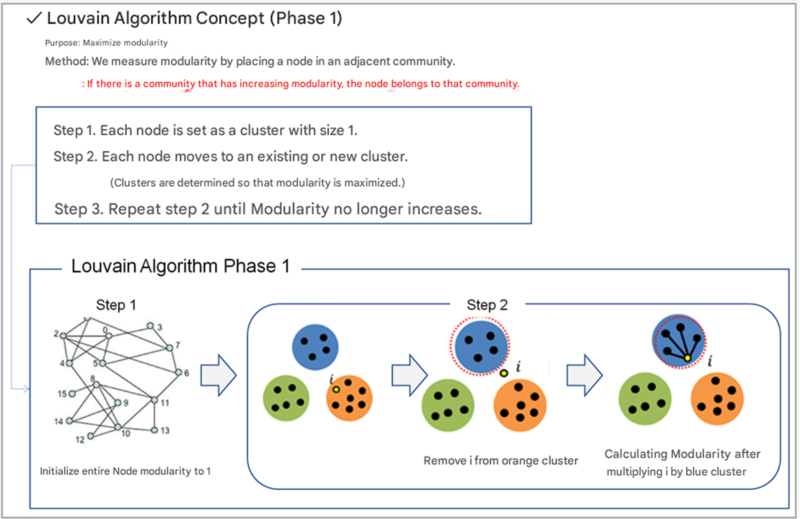
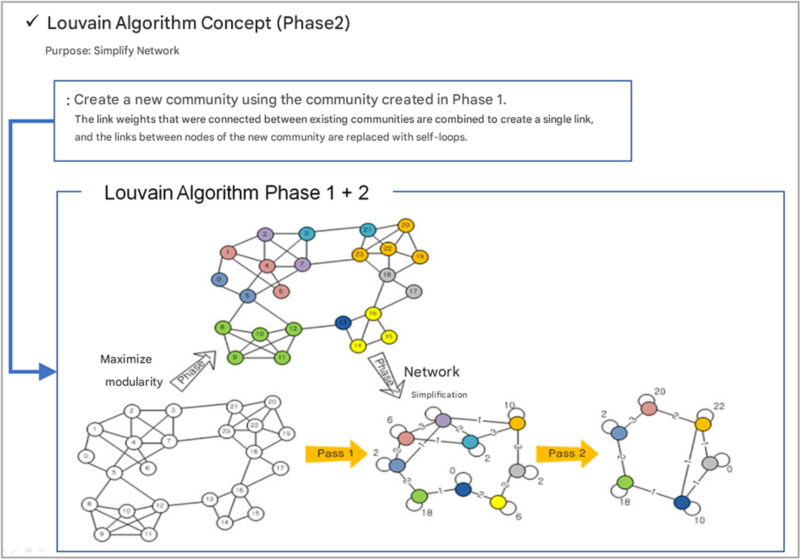
Among the algorithms that utilize modularity, we decided to verify the idea through the Louvain algorithm, a representative algorithm. The Louvain algorithm is divided into Phase 1 and Phase 2.
The purpose of Phase 1 is to maximize modularity. The method is to measure modularity by placing a node in another adjacent community and determine the cluster so that modularity is maximized.
[Fig.3-7-5] Louvain Algorithm Phase 1
The purpose of Phase 2 is to simplify the network by maximizing modularity in Phase 1. The link weights that were connected between existing communities are merged into a single link, and the links between nodes in new communities are replaced with self-loops to simplify the network.
[Fig.3-7-6] Louvain Algorithm Phase 2
4. Results
4.1. Cumulative number of Seoul Bike rentals in Gangseo-gu according to D Index
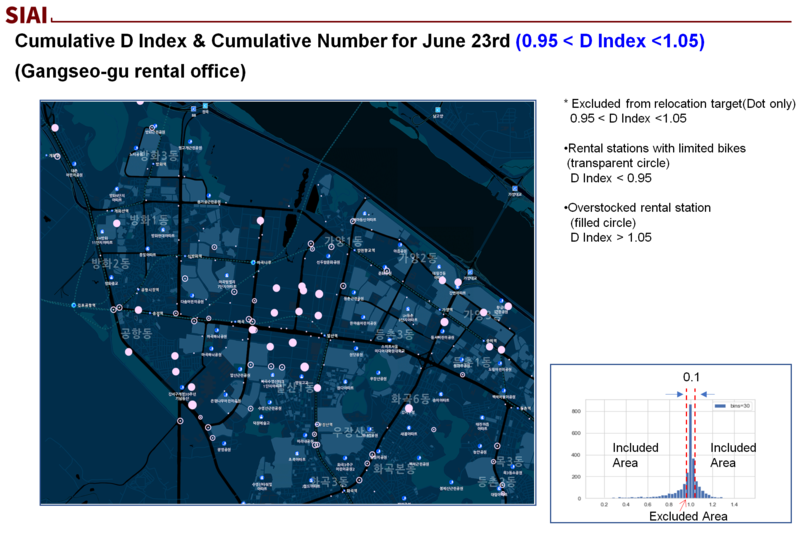
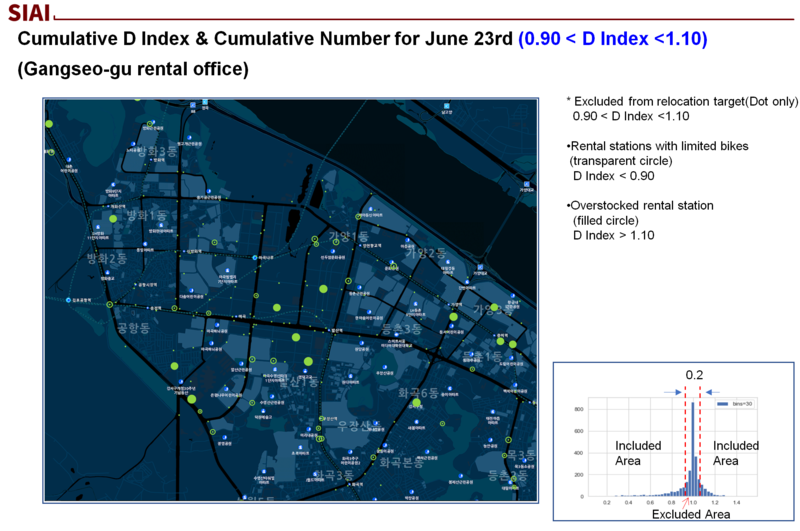
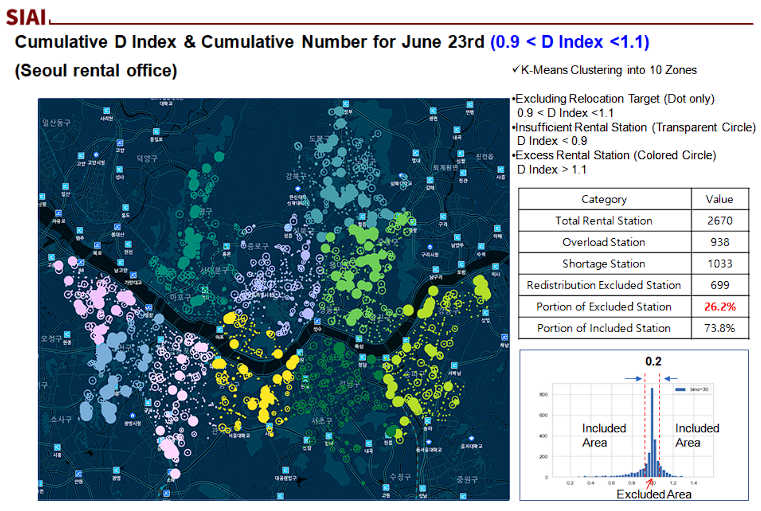
The picture you see is a picture showing the cumulative number of Seoul Bike bicycles in Gangseo-gu by rental station location in June 2023, with a D Index of 0.95 to 1.05 and a range of 0.1.
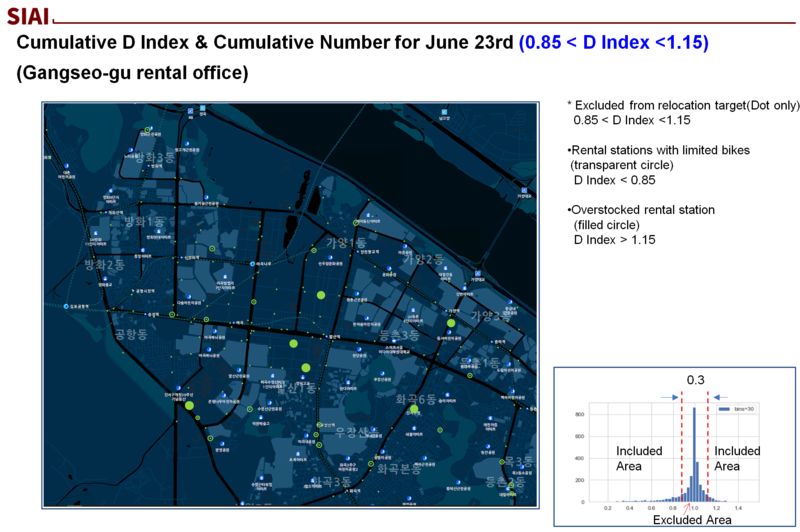
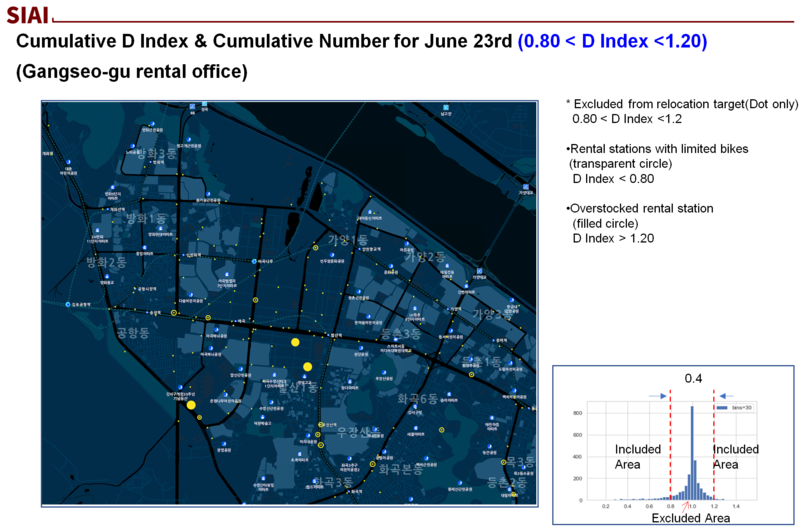
Transparent circles are negative cumulative amounts, indicating places with a large number of rentals, and filled circles are places with a large number of returns. Also, the places with dots are rental stations excluded from the reallocation target.
Currently, only rental stations within the range of 0.1 are excluded, so there are many target rental stations, and the cost is higher than other cases with a large range. (Low reallocation efficiency)
When the range is as wide as 0.4, this is the case where there are the most rental stations excluded from relocation, and in this case, there are the fewest rental stations subject to relocation, so the cost of relocating Seoul Bike is greatly reduced, making it an efficient section.
[Fig.4-1-1] Gangseo-gu rental stations scheduled to relocate bikes (D Index : 0.1)[Fig.4-1-2] Gangseo-gu rental stations scheduled to relocate bikes (D Index : 0.2)[Fig.4-1-3] Gangseo-gu rental stations scheduled to relocate bikes (D Index : 0.3)[Fig.4-1-4] Gangseo-gu rental stations scheduled to relocate bikes (D Index : 0.4)
4.2. Cumulative number of Seoul Bike rentals in Seoul according to D Index
The picture you see is a picture showing the cumulative number of Seoul bikes by rental station location in Seoul as of June 2023. The D index is 0.95~1.05, and the range is 0.1.
Transparent circles indicate places with a large number of rentals with negative cumulative numbers, and filled circles indicate places with a large number of returns. Also, the places with dots are rental stations excluded from the redistribution target.
Currently, only rental stations within the 0.1 range are excluded, so the cost is higher than other cases with many target rental stations and a large range. (Low redistribution efficiency)
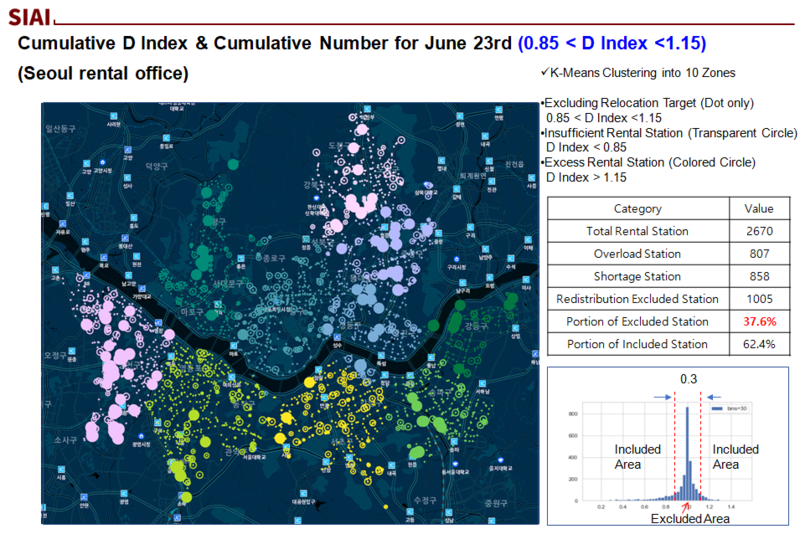
[Fig.4-2-1] Seoul rental stations scheduled to relocate bikes (D Index : 0.1)[Fig.4-2-2] Seoul rental stations scheduled to relocate bikes (D Index : 0.2)[Fig.4-2-3] Seoul rental stations scheduled to relocate bikes (D Index : 0.3)[Fig.4-2-4] Seoul rental stations scheduled to relocate bikes (D Index : 0.4)
In the case where the Index Range for the Rental Stations Excluding Relocation Targets is 0.4, the ratio of rental stations excluded from the relocation target for Seoul Bike is 66.6\%, and the ratio of rental stations subject to relocation is low at 33.4\%.
In this case, the cost of Seoul Bike relocation will be greatly reduced, and the relocation efficiency can also be the highest.
4.3. Results of spatial equilibrium implementation through application of Louvain algorithm
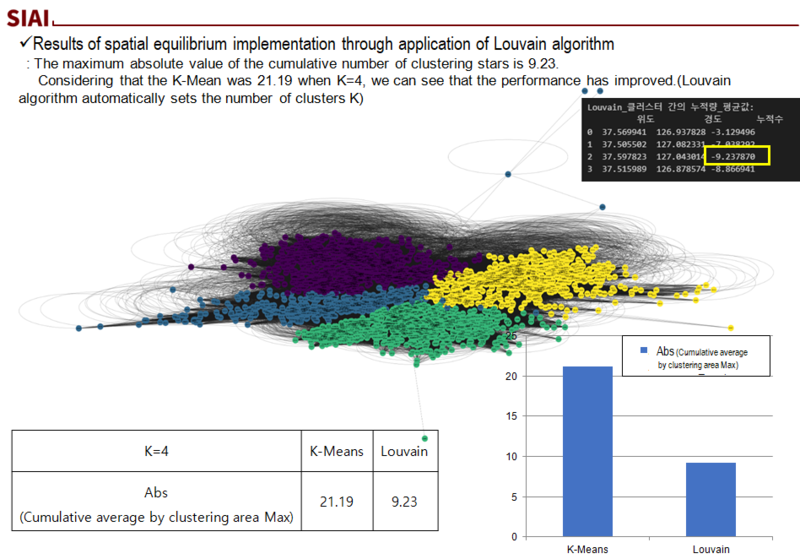
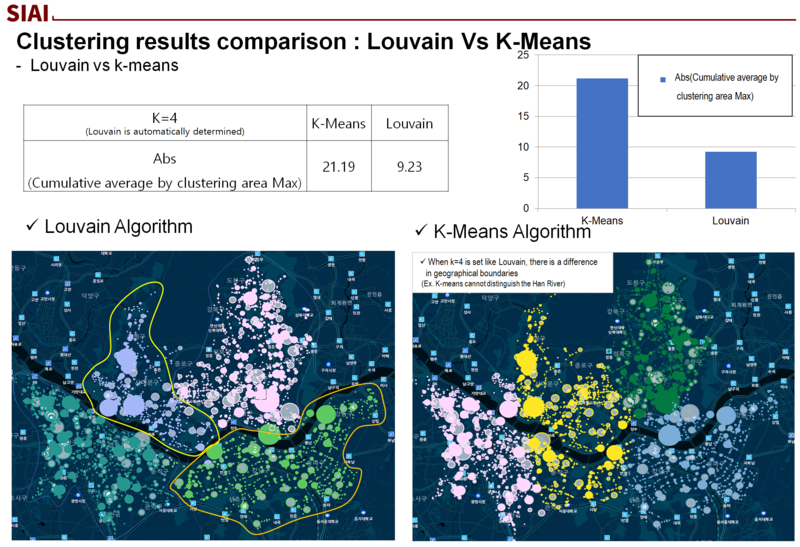
As explained in the idea above, the result of setting up Node and Edge using the rental and return data of Seoul Bike and applying the Louvain algorithm showed much better results than K-Means, which simply used the Euclidean coordinates of the rental station location.
When clustering, the cumulative average by region was used as an indicator of performance, and the closer it is to 0, the closer it is to the partial sum, which means that the bicycle is likely to move only within the clustering region.
K-Means is 21.19, while Louvain is 9.23. We were able to confirm that the cumulative average by region was reduced by almost half.
[Fig.4-3-1] Results of spatial equilibrium implementation through application of Louvain algorithm
And the K-Means algorithm shows clustering that ignores the Han River, while the Louvain algorithm clustering seems to reflect the geographical characteristics of Seoul better.
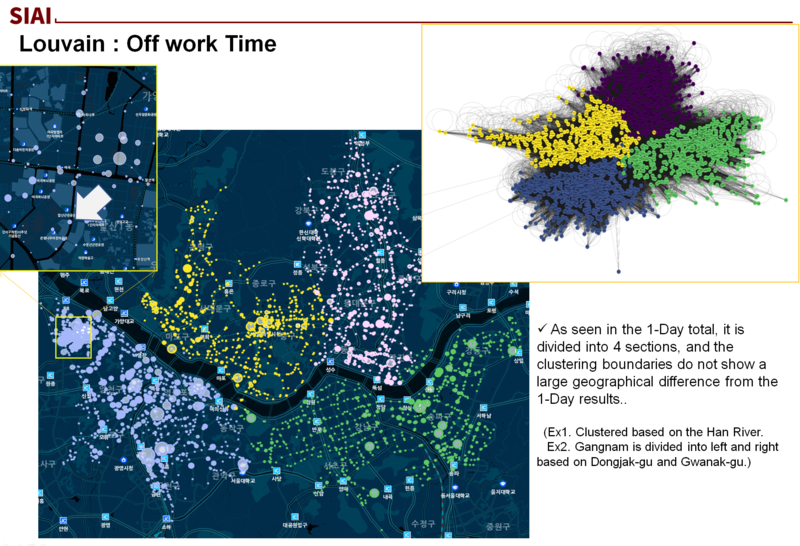
The results below are the results of the Seoul Bike clustering classified by the K-Means and Louvain algorithms, colored on the map of Seoul.
While K-Means shows results that cannot distinguish the Han River, the Louvain algorithm shows the boundary of the Han River much more clearly.
[Fig.4-3-2] Clustering results comparison : Louvain Vs K-Means[Fig.4-3-3] Louvain Result : Go work Time[Fig.4-3-4] Louvain Result : Off work Time
References
1. F. Chiariotti, C. Pielli, A. Zanella and M. Zorzi, "A dynamic approach to rebalancing bike-sharing systems", Sensors
2. M. Dell’Amico, E. Hadjicostantinou, M. Iori and S. Novellani, "The bike sharing rebalancing problem: Mathematical formulations and benchmark instances"
3. P. Yi, F. Huang and J. Peng, "A rebalancing strategy for the imbalance problem in bike-sharing systems"
4. C. M. de Chardon, G. Caruso and I. Thomas, "Bike-share rebalancing strategies patterns and purpose"
5. C. Zhang, L. Zhang, Y. Liu and X. Yang, "Short-term prediction of bike-sharing usage considering public transport: A lstm approach"
6. S. Ruffieux, N. Spycher, E. Mugellini and O. A. Khaled, "Real-time usage forecasting for bike-sharing systems: A study on random forest and convolutional neural network applicability"
Recent developments in the urban landscape—such as sub-urbanization, counter-urbanization, and re-urbanization—have given rise to complicated scenarios where administrative jurisdictions are newly formed and intersect with existing ones. This presents unique challenges to traditional models of tax competition. This paper examines the economic implications of such overlapping jurisdictions, particularly focusing on their impact on tax policy.
Overlapping jurisdictions are characterized by multiple local governments exercising different levels of authority over the same geographic area. These arrangements often merge as responses to address urban sprawl or provide specialized services tailored to local needs. However, they also create a intricate network of fiscal relationships that can lead to inefficiencies in resource allocation and public service delivery.
For instance, local governments in the U.S., including counties, cities, towns, and special districts, have varying degrees of taxing powers. Residents in certain areas might be subject to property taxes levied by their town, county, school district, and special districts (such as fire or library districts), all operating within the same geographic space. This multi-layered governance structure not only affects residents' tax burdens but also influences local governments' decision-making processes regarding tax rates and public service provision. The resulting fiscal landscape provides a rich setting for examining the dynamics of tax competition and cooperation among overlapping jurisdictions.
Traditional models of tax competition, such as Wilson [4] and Zodrow and Mieszkowski [5], typically assume clear demarcations between competing jurisdictions. However, these models do not adequately capture the dynamics of overlapping administrative divisions. In such settings, local governments must navigate not only horizontal competition with neighboring jurisdictions but also a form of vertical competition within the same geographic space.
This paper aims to extend the literature on tax competition by developing a theoretical framework that accounts for the unique characteristics of overlapping jurisdictions. Specifically, we address the following research questions:
How do overlapping administrative divisions affect the strategic tax-setting behavior of local governments?
What are the implications of such overlapping structures for the provision of public goods and services?
How does the presence of overlapping jurisdictions influence the welfare outcomes predicted by traditional tax competition models?
To address these questions, we develop a game-theoretic model that incorporates multiple layers of local government operating within the same geographic space. This approach allows us to analyze the strategic interactions between overlapping jurisdictions and derive insights into the resulting equilibrium tax rates and levels of public good provision.
Our analysis contributes to the existing literature in several ways. First, it provides a formal framework for understanding tax competition in the context of overlapping jurisdictions, which is increasingly relevant in modern urban governance. Second, it offers insights into the potential inefficiencies that arise from such administrative structures and suggests possible policy interventions to mitigate these issues. Finally, it extends the theoretical foundations of fiscal federalism to account for more complex governance arrangements.
Our study addresses the current realities of fiscal federalism in developed economies as well as provides valuable insights for countries where local governments are yet to achieve significant fiscal autonomy. The lessons drawn from this analysis can inform policy discussions on decentralization, local governance structures, and intergovernmental fiscal relations in various contexts.
The remainder of this paper is organized as follows: Section II reviews the relevant literature on tax competition and fiscal federalism. Section III presents our theoretical model and derives key equilibrium results. Section IV discusses the implications of our findings for public policy and urban governance. Section V concludes and suggests directions for future research.
II. Literature Review
Tax competition has been one of the central themes in public economics. Tiebout [1]'s seminal work on local public goods laid the foundation for this field, proposing a model of "voting with feet" where residents moving to jurisdictions offering their preferred combination of taxes and public services. Oates [2] further developed these ideas and presented the decentralization theorem which posits that, under certain conditions, decentralized provision of public goods is welfare-maximizing.
Works of Wilson [4] and Zodrow and Mieszkowski [5] developed the basic tax competition model, where jurisdictions compete for a mobile capital tax base. This model predicts inefficiently low tax rates and underprovision of public goods, which is often referred to as the "race to the bottom." Wildasin [6] further demonstrated that the Nash equilibrium in tax rates is generally inefficient by incorporating strategic interactions between jurisdictions.
Researchers began to consider more diverse institutional settings. Keen and Kotsogiannis [11] analyzed the interaction between vertical tax competition (between different levels of government) and horizontal tax competition (between governments at the same level). Their work demonstrated that in federal systems, the tax rates can be high or low depending on the relative strength of vertical and horizontal tax externalities, contrary to the ``race to the bottom'' prediction of earlier models.
Itaya, Okamura, and Yamaguchi [12] examined tax coordination in a repeated game setting with asymmetric regions. They find that the sustainability of tax coordination depends on the degree of asymmetry between regions and the type of coordination--partial or full. While asymmetries can complicate coordination efforts, the repeated nature of interactions can facilitate cooperation under certain conditions. Their work demonstrates that full tax coordination can be sustained for a wider range of parameters compared to partial coordination.
Building on this, Ogawa and Wang [14] incorporated fiscal equalization into the framework of asymmetric tax competition in a repeated game context. Their findings reveal that fiscal equalization can influence the sustainability of tax coordination, sometimes making it more difficult to maintain. The impact of equalization schemes on tax coordination is contingent on the degree of regional asymmetry and the specific parameters of the equalization policy.
The case of overlapping jurisdictions represents a frontier in tax competition research. While not extensively studied, some works have begun to address such cases. Hochman, Pines, and Thisse [9] developed a model of metropolitan governance with overlapping jurisdictions, showing how this can lead to inefficiencies in public good provision. Esteller-Mor´e and Sol´e-Oll´e [10] analyzed tax mimicking in a setting with overlapping tax bases, finding evidence of both horizontal and vertical interactions.
Game-theoretic approaches have been instrumental in advancing our understanding of tax competition dynamics. Wildasin [6] pioneered the use of game theory in tax competition, modeling jurisdictions as strategic players in a non-cooperative game. This approach demonstrated that the Nash equilibrium in tax rates is generally inefficient, providing a formal basis for the ``race to the bottom'' hypothesis. The work of Itaya, Okamura, and Yamaguchi [12] and Ogawa and Wang [14] further extended this game-theoretic approach to repeated games, offering insights into the possibilities for tax coordination over time.
While these game-theoretic approaches have significantly advanced our understanding of tax competition, they have largely failed to address the complexities of fully overlapping jurisdictions. Most models assume clear boundaries between competing jurisdictions, leaving a gap in our understanding of scenarios where multiple levels of government have taxing authority over the same geographic area.
The welfare implications of tax competition have been a subject of ongoing debate. While the "race to the bottom" hypothesis suggests negative welfare consequences, some scholars have argued for potential benefits. Brennan and Buchanan [3] proposed that tax competition could serve as a check on the excessive growth of government, a view that has found some support in subsequent empirical work (e.g., [13]).
Policy responses to tax competition have also been extensively studied. Proposals range from tax harmonization [7] to the implementation of corrective subsidies [8]. The effectiveness of these measures, particularly in complex settings with overlapping jurisdictions, remains an active area of research.
While the literature on tax competition has made significant strides in understanding the dynamics of fiscal interactions between jurisdictions, several areas warrant further investigation. The case of fully overlapping jurisdictions, in particular, presents a rich opportunity for both theoretical modeling and empirical analysis. This study aims to fill in this gap by accounting for overlapping jurisdictions in traditional game-theoretic models of tax competition.
III. Model
This study extends the tax competition models of Itaya, Okamura, and Yamaguchi [12] and Ogawa and Wang [14] by introducing an overlapping jurisdiction. Our approach is grounded in the Solow growth model, which provides a robust framework for analyzing long-term economic growth and capital accumulation. The Solow model's emphasis on capital accumulation and technological progress makes it suitable for our analysis of tax competition, as these factors influence jurisdictions' tax bases and policy decisions.
The Solow model's assumptions of diminishing returns to capital and constant returns to scale align well with our focus on regional differences in capital endowments and production technologies. Moreover, its simplicity allows for tractable extensions to multi-jurisdiction settings.
A. Setup
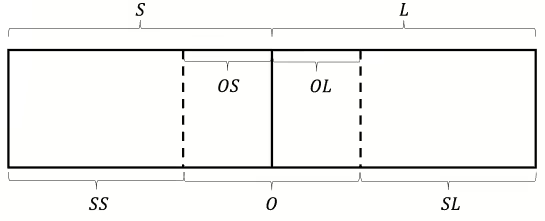
We consider a country divided into three regions: two asymmetric regions, $S$ and $L$, and an overlapping region, $O$, which equally overlaps with $S$ and $L$. All regions have independent authority to impose capital taxes. This setup allows us to examine the interactions between horizontal tax competition (between $S$ and $L$) and the unique dynamics introduced by the overlapping jurisdiction $O$. Let us further denote that the regions of $S$ and $L$ that do not overlap with $O$ are $SS$(Sub-$S$) and $SL$(Sub-$L$), respectively, while those that overlap with $O$ are $OS$ and $OL$ (see Figure 1).
FIGURE 1. VISUAL EXPLANATION OF THE HYPOTHETICAL COUNTRY
Here, we make the following key assumptions:
Population: Population is evenly spread across the country. Hence, regions $S$ and $L$ have equal populations. Furthermore, regions $SS$, $SL$, and $O$ have equal populations. This assumption, while strong, allows us to isolate the effects of capital endowment and technology differences.
Labor Supply and Individual Preferences: Residents inelastically supply one unit of labor to firms in their region and have identical preferences. Furthermore, they strive to maximize their utilities given their budget constraints. While this assumption simplifies labor market dynamics, it is reasonable in the short to medium term, especially in areas with limited inter-regional mobility.
Production: Firms in each region produce homogeneous consumer goods and maximize their profits. This assumption allows us to focus on capital allocation without the complications of product differentiation.
Capital Mobility: Capital is perfectly mobile across regions, reflecting the ease of capital movement in economies, especially within a single country.
Asymmetric Endowments and Technology: Regions $S$ and $L$ differ in capital endowments and production technologies. This assumption captures real-world regional disparities and is crucial for generating meaningful tax competition dynamics.
Public Goods Provision: Regions $S$ and $L$ provide generic public goods $G$, while region $O$ provides specific public goods $H$ to the extent that maximizes their representative resident's utilities. This reflects the often-observed division of responsibilities between different levels of government.
These assumptions, while simplifying the real world, allow us to focus on the core mechanisms of tax competition in overlapping jurisdictions. They provide a tractable framework for analyzing the strategic interactions between jurisdictions while capturing key elements of real-world complexity.
B. Production and Capital Allocation
Let $\bar{k}_i$ be the capital endowment per capita for regions $i$ and $\bar{k}$ be the capital endowments per capita of the national economy. For regions $S, L$ and $O$, it can be expressed as follows:
where $\varepsilon \in \left( 0,\ \bar{k} \right\rbrack$ represents asymmetric endowments between regions $S$ and $L$. $\bar{k}_O = \bar{k}$ follows from the assumption that the population is evenly dispersed across the country.
Let $L_i$ and $K_i$ be the labor and capital inputs for production in region $i$. It can be easily inferred that
where $A_i$ and $B_i > 2K_i / L_i$ represent labor and capital productivity coefficients, respectively. Although regions $S$ and $L$ differ in capital production technology, there is no difference in labor production technology, so $A_{L} = A_{S}$ while $B_{L} \neq \ B_{S}$. Note that this function exhibits constant returns to scale and diminishing returns to capital. Furthermore, we assume that sub-regions without overlaps ($SL$ and $SS$) have equivalent technology coefficients with their super-regions ($L$ and $S$). The technology parameter of the overlapping region is a weighted average of $B_S$ and $B_L$, where the weights are the proportion of capital invested from $S$ and $L$.
As mentioned above, capital allocation across regions is determined by profit-maximizing firms and the free movement of capital. Let $\tau_i$ be the effective tax rate for region $i$. Then, we can infer that the real wage rate $w_i$ and real interest rates $r_i$ are:
where $t_i = (1-\alpha_i)\tau_O$ for $i \in \{S, L\}$, $0$ for $i\in \{SS, SL\}$, $\tau_S$ for $i = OS$, and $\tau_L$ for $i = OL$.
The capital market equilibrium for the national economy is reached when the sum of capital demands is equal to the exogenously fixed total capital endowment: $K_S + K_L = 2l\bar{k}$. In equilibrium, the interest rates and capital demanded in each region are as follows: \begin{equation} \begin{aligned} &r^* = \frac{1}{2}\big(\left(B_S + B_L \right) - \left(\tau_S + \tau_L + (2-\alpha_S-\alpha_L)\tau_O\right)\big) - 2\bar{k} \\ &K_S^* = lk_S^* = l\bigg(\bar{k} + \frac{1}{4}\big( (\tau_L - \tau_S - (\alpha_L - \alpha_S)\tau_O ) - (B_L - B_S)\big) \bigg) \\ &K_L^* = lk_L^* = l\bigg(\bar{k} + \frac{1}{4}\big( (\tau_S - \tau_L + (\alpha_L - \alpha_S)\tau_O ) + (B_L - B_S)\big) \bigg) \\ &K_{SS}^* = \frac{2}{3}lk_{SS}^* = \frac{2l}{3}\bigg(\bar{k} + \frac{1}{4}\big( (\tau_L - \tau_S + (2 - \alpha_L - \alpha_S)\tau_O ) - (B_L - B_S)\big) \bigg) \\ &K_{SL}^* = \frac{2}{3}lk_{SL}^* =\frac{2l}{3}\bigg(\bar{k} + \frac{1}{4}\big( (\tau_S - \tau_L + (2 - \alpha_L - \alpha_S)\tau_O ) + (B_L - B_S)\big) \bigg) \\ &K_O^* = \frac{2}{3}lk_O^* = \frac{2l}{3}\left(\bar{k} - \frac{1}{2}(2-\alpha_S-\alpha_L)\tau_O\right) \end{aligned} \end{equation} We denote $B_L - B_S = \theta$, henceforth.
C. Government Objectives and Tax Rates
Given that individuals in the country have identical preferences and inelastically supply one unit of labor to the regional firms, we can infer that all inhabitants receive a common return on capital of $r^*$ eventually, and they use all income to consume private good $c_i$. Hence, the budget constraint for an individual residing in region $i \in \{S, L, O\}$ and the sum of individuals in region $i$ will be
\begin{equation} \begin{aligned} c_i &= w_i^* + r^*\bar{k}_i \\ C_i &= \begin{cases} l(w^*_i + r^*\bar{k}_i) & \text{ for } i \in \{S, L\}\\ \dfrac{2l}{3}(w^*_i + r^*\bar{k}) & \text{ for } i = O \end{cases} \end{aligned} \end{equation}
In addition, we have assumed that the overlapping district is a special district providing a special public good--for example education or health--that the other two districts do not provide. $S$ and $L$ provide their local public goods $G_i$. Then the total public goods provided in region $i$ can be expressed as:
\begin{equation} \begin{aligned} G_i &= \begin{cases} K_i^*\tau_i & \text{ for } i \in \{S, L\}\\ (1-\alpha_S)K_S^*\tau_S + (1-\alpha_L)K_L^*\tau_L & \text{ for } i = O \end{cases} \\ H_i &= \begin{cases} (1-\alpha_i)K_i^*\tau_O & \hspace{1.45in} \text{ for } i \in \{S, L\}\\ K_i^*\tau_i & \hspace{1.45in} \text{ for } i = O \end{cases} \end{aligned} \end{equation}
Accordingly, each government in region $i$ chooses $\tau_i$ such that maximizes the following social welfare function, which is represented as the sum of individual consumption and public good provision:
This objective function captures the trade-off faced by governments between attracting capital through lower tax rates and generating revenue for public goods provision. After solving equation (9), we obtain the reaction functions, i.e. the tax rates at the market equilibrium (see Appendix 1 for details):
The tax rates derived in the previous section represent the optimal response functions for each region. These functions encapsulate each region's best strategy given the strategies of other regions, as each jurisdiction aims to maximize its social welfare function. In essence, these functions delineate the most advantageous tax rate for each region, contingent upon the tax rates set by other regions.
The existence of a Nash equilibrium is guaranteed in our model, as the slopes of the reaction functions are less than unity, satisfying the contraction mapping principle. This ensures that the iterative process of best responses converges to a unique equilibrium point given $\alpha_L$ and $\alpha_S$. The one-shot Nash equilibrium tax rates are given by (see Appendix 2 for details):
These equilibrium tax rates reveal several important insights. First, the tax rates of regions $S$ and $L$ are influenced by the asymmetry in capital endowments ($\varepsilon$) and productivity ($\theta$), as well as the presence of the overlapping jurisdiction $O$. Second, the overlapping jurisdiction's tax rate is solely determined by the average capital endowment ($\bar{k}$) and the proportion of resources allocated from S and L ($\alpha_S$ and $\alpha_L$). Third, When $\alpha_L + \alpha_S = 4/3$, we have $\tau_O^N = 0$, which effectively reduces our model to a scenario without the overlapping jurisdiction.
The Nash equilibrium also yields equilibrium values for the interest rate and capital demanded in each region:
LEMMA 1 (Net Capital Position): The sign of $\Phi \equiv \varepsilon - \frac{\theta}{4}$ determines the net capital position of regions S and L. When $\Phi > 0$, L is a net capital exporter and S is a net capital importer, and vice versa when $\Phi < 0$. PROOF: From equation (12), we can see that: \begin{align*} K_L^N - K_S^N &= l\left(\left(\bar{k} + \frac{1}{2}\left(\varepsilon + \frac{\theta}{4} \right)\right) - \left(\bar{k} - \frac{1}{2}\left(\varepsilon + \frac{\theta}{4} \right)\right)\right) \\ &= l\left(\varepsilon + \frac{\theta}{4}\right) \end{align*} The sign of this difference is determined by $\varepsilon - \frac{\theta}{4} \equiv \Phi$.
LEMMA 2 (Overlapping Jurisdiction’s Effectiveness): The sign of $\Gamma \equiv \frac{3\left( \alpha_{L} + \alpha_{S} \right) - 4}{\left( 2 - \left( \alpha_{L} + \alpha_{S} \right) \right)\left( \alpha_{L} + \alpha_{S} \right)}$ determines the effective tax rate of O. Moreover, $\alpha_{L} + \alpha_{S}$ must be greater than 4/3 for O to provide a positive sum of special public good H. PROOF: From equation (11), we see that the sign of $\tau_O^N$ is determined by the sign of $\Gamma$. The numerator of $\Gamma$ is positive when $\alpha_{L} + \alpha_{S} > 4/3$, and the denominator is always positive for $\alpha_{L} + \alpha_{S} < 2$. Therefore, $\Gamma > 0$ (and consequently $\tau_O^N > 0$) when $\alpha_{L} + \alpha_{S} > 4/3$.
These lemmas provide crucial insights into the dynamics of our model. First, the introduction of the overlapping jurisdiction $O$ does not alter the net capital positions of $S$ and $L$ compared to a scenario without $O$. The capital flow between $S$ and $L$ is determined solely by the relative strengths of their capital endowments ($\varepsilon$) and productivity differences ($\theta$). In addition, the effectiveness of the overlapping jurisdiction in providing public goods is contingent on receiving a sufficient allocation of resources from $S$ and $L$.
These findings contribute to our understanding of tax competition in multi-layered jurisdictional settings and provide a foundation for analyzing the welfare implications of overlapping administrative structures.
IV. Simulations and Results
To better understand the implications of our theoretical model and address the research questions posed in the introduction, we conducted a series of simulations. These simulations allow us to visualize the non-linear relationships between key variables and provide insights into the strategic behavior of jurisdictions in our overlapping tax competition model.
A. Net Capital Positions and Tax Competition Dynamics
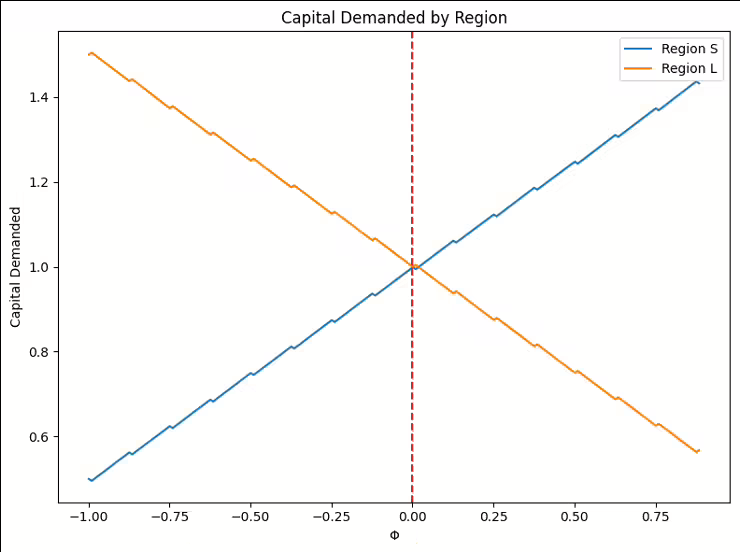
Our first simulation focuses on the net capital positions of regions $S$ and $L$, as determined by the parameter $\Phi \equiv \varepsilon - \theta/4$. Figure 2 illustrates how changes in $\Phi$ affect the capital demanded by each region.
As shown in Figure 2, when $\Phi > 0$, region $L$ becomes a net capital exporter, while region $S$ becomes a net capital importer. This result directly addresses our first research question about how overlapping administrative divisions affect strategic tax-setting behavior. The presence of the overlapping jurisdiction $O$ does not alter the net capital positions of $S$ and $L$ compared to a scenario without $O$.
However, it does influence their tax-setting strategies, as evidenced by the Nash equilibrium tax rates in equation (12). These equations show that $S$ and $L$ adjust their tax rates in response to the overlapping jurisdiction $O$ by factors of $\Gamma(1-\alpha_S)\bar{k}$ and $\Gamma(1-\alpha_L)\bar{k}$, respectively. This strategic adjustment demonstrates how the presence of an overlapping jurisdiction alters tax-setting behavior, even when it doesn't change net capital positions.
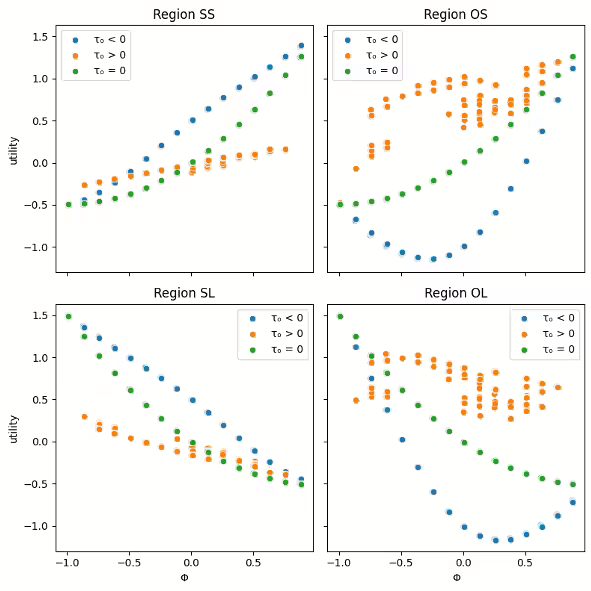
FIGURE 2. CAPITAL DEMANDED BY REGIONFIGURE 3. REPRESENTATIVE RESIDENTS’ UTILITY FROM PUBLIC GOODS
B. Public Good Provision and Welfare Implications
Then, we examine the utility derived from public goods by representative residents in each region. Figure 3 visualizes these utilities across different values of $\Phi$ and $\tau_O$.
Figure 3 reveals several important insights. First, the utility derived from public goods varies significantly across sub-regions ($SS$, $SL$, $OS$, $OL$), highlighting the complex welfare implications of overlapping jurisdictions. Second, the overlapping region $O$'s tax rate ($\tau_O$) has a substantial impact on the utility derived from public goods, especially in the overlapping sub-regions $OS$ and $OL$. Third, the relationship between $\Phi$ and public good utility is non-linear and differs across regions, suggesting that the welfare implications of tax competition are not uniform. These findings suggest that the presence of an overlapping jurisdiction can lead to heterogeneous welfare effects.
C. The Role of the Overlapping Jurisdiction
Our model and simulations highlight the crucial role played by the overlapping jurisdiction $O$. The tax rate of $O$ ($\tau_O^N = \Gamma\bar{k}$) is determined by the proportion of resources allocated from the primary economies ($\alpha_S$ and $\alpha_L$), or specifically $\Gamma$. This relationship reveals that the overlapping jurisdiction's ability to provide public goods ($H$) is contingent on receiving a sufficient proportion of resources from $S$ and $L$. Specifically, $\alpha_L + \alpha_S$ must exceed $4/3$ for $O$ to provide a positive sum of special public goods.
This finding has important implications for the design of multi-tiered governance systems. It suggests that overlapping jurisdictions need a critical mass of resource allocation to function effectively, which may inform decisions about the creation and empowerment of special-purpose districts or other overlapping administrative structures.
V. Conclusion
This study has examined the dynamics of tax competition in regions with overlapping tax jurisdictions, leveraging game theory to develop a theoretical framework for understanding these administrative structures. By constructing a simplified model and deriving Nash equilibrium conditions, we have identified several key insights that contribute to the existing literature on tax competition. Our analysis reveals that while the introduction of an overlapping jurisdiction does not alter the net capital positions of the primary regions, it leads to strategic adjustments in tax rates. This finding extends the traditional models of tax competition by incorporating the complexities of multi-tiered governance structures.
The effectiveness of the overlapping jurisdiction in providing public goods is found to be contingent on receiving a sufficient allocation of resources from the primary regions. Moreover, our simulations demonstrate that the presence of overlapping jurisdictions can lead to heterogeneous welfare effects across sub-regions, challenging the uniform predictions of traditional tax competition models and suggesting the need for more nuanced policy approaches.
While our study provides valuable insights, it is important to acknowledge its limitations. The use of a simplified model, while allowing for tractable analysis, inevitably omits some real-world complexities. Factors such as population mobility, diverse tax bases, and income disparities among residents were not incorporated into the model. Furthermore, our analysis is static, which may not capture the dynamic nature of tax competition and capital flows over time. The assumption of identical preferences for public goods across all residents may not reflect the heterogeneity of preferences in real-world settings. Additionally, the model assumes perfect information among all players, which may not hold in practice where information asymmetries can influence strategic decisions.
To address these limitations and further advance our understanding of tax competition in a wide array of administrative structures, several avenues for future research are proposed. Developing dynamic models that capture the evolution of tax competition over time, potentially using differential game theory approaches, could provide insights into the long-term implications of overlapping jurisdictions. Incorporating heterogeneous preferences for public goods among residents would allow for a more nuanced examination of how diverse citizen demands affect tax competition and public good provision in overlapping jurisdictions.
Empirical studies using data from regions with overlapping jurisdictions, such as special districts in the United States, could test the predictions of our theoretical model and provide valuable real-world validation. Extending the model to include various policy interventions, such as intergovernmental transfers or tax harmonization efforts, could help evaluate their effectiveness in mitigating potential inefficiencies. Incorporating insights from behavioral economics to account for bounded rationality and other cognitive factors may provide a more realistic representation of tax-setting behavior in complex jurisdictional settings.
In conclusion, this study provides a theoretical foundation for understanding tax competition in regions with overlapping jurisdictions. By highlighting the complex interactions between multiple layers of government, our findings contribute to the broader literature on fiscal federalism and public economics. As urbanization continues and governance structures become increasingly complex, the insights derived from this research can inform policy discussions on decentralization, local governance structures, and intergovernmental fiscal relations. Future work in this area has the potential to significantly enhance our understanding of modern urban governance and contribute to the development of more effective and equitable fiscal policies in multi-tiered administrative structures.
References
[1] C. M. Tiebout, “A pure theory of local expenditures,” Journal of Political Economy, vol. 64, no. 5, pp. 416–424, 1956. [2] W. E. Oates, Fiscal federalism. Harcourt Brace Jovanovich, 1972. [3] G. Brennan and J. M. Buchanan, The power to tax: Analytical foundations of a fiscal constitution. Cambridge University Press, 1980. [4] J. D. Wilson, “A theory of interregional tax competition,” Journal of Urban Economics, vol. 19, no. 3, pp. 296–315, 1986. [5] G. R. Zodrow and P. Mieszkowski, “Pigou, tiebout, property taxation, and the underprovision of local public goods,” Journal of Urban Economics, vol. 19, no. 3, pp. 356–370, 1986. [6] D. E. Wildasin, “Nash equilibria in models of fiscal competition,” Journal of Public Economics, vol. 35, no. 2, pp. 229–240, 1988. [7] R. Kanbur and M. Keen, “Jeux sans fronti`eres: Tax competition and tax coordination when countries differ in size,” American Economic Review, pp. 877–892, 1993. [8] J. A. DePater and G. M. Myers, “Strategic capital tax competition: A pecuniary externality and a corrective device,” Journal of Urban Economics, vol. 36, no. 1, pp. 66–78, 1994. [9] O. Hochman, D. Pines, and J.-F. Thisse, “On the optimality of local government: The effects of metropolitan spatial structure,” Journal of Economic Theory, vol. 65, no. 2, pp. 334–363, 1995. [10] A. Esteller-Mor´e and A. Sol´e-Oll´e, “Vertical income tax externalities and fiscal interdependence: Evidence from the us,” Regional Science and Urban Economics, vol. 31, no. 2-3, pp. 247–272, 2001. [11] M. Keen and C. Kotsogiannis, “Does federalism lead to excessively high taxes?” American Economic Review, vol. 92, no. 1, pp. 363–370, 2002. [12] J.-i. Itaya, M. Okamura, and C. Yamaguchi, “Are regional asymmetries detrimental to tax coordination in a repeated game setting?” Journal of Public Economics, vol. 92, no. 12, pp. 2403–2411, 2008. [13] L. P. Feld, G. Kirchg¨assner, and C. A. Schaltegger, “Decentralized taxation and the size of government: Evidence from swiss state and local governments,” Southern Economic Journal, vol. 77, no. 1, pp. 27–48, 2010. [14] H. Ogawa and W. Wang, “Asymmetric tax competition and fiscal equalization in a repeated game setting,” International Tax and Public Finance, vol. 23, no. 6, pp. 1035–1064, 2016.
APPENDIX 1 - DERIVING REACTION FUNCTIONS
Let us get the partial derivatives that are needed to get the first order condition of social utility function. Starting with the easier ones,
SIAI Editor is the institutional editorial identity of the Swiss Institute of Artificial Intelligence (SIAI). It covers research and analysis across AI policy and governance, economics and finance, law and regulation, workforce and education, scientific applications, computational methods, infrastructure, and the strategic adoption of artificial intelligence.
Publications under SIAI Editor are prepared or coordinated by SIAI’s research and editorial team and include research synthesis, policy and industry analysis, technical interpretation, and interdisciplinary work connecting artificial intelligence with established fields of research and professional practice.
Published
The Gordon School of Business (GSB) under Swiss Institute of Artificial Intelligence awarded degrees to four students in September 2024.
The graduating students and their dissertations were:
The 2024 Best Paper of the Year was awarded to Yeonsook Kwak for 'Sleep State Detection Method by Data-generated likelihood'.
Picture
Member for
1 year 5 months
Real name
SIAI Editor
Bio
SIAI Editor is the institutional editorial identity of the Swiss Institute of Artificial Intelligence (SIAI). It covers research and analysis across AI policy and governance, economics and finance, law and regulation, workforce and education, scientific applications, computational methods, infrastructure, and the strategic adoption of artificial intelligence.
Publications under SIAI Editor are prepared or coordinated by SIAI’s research and editorial team and include research synthesis, policy and industry analysis, technical interpretation, and interdisciplinary work connecting artificial intelligence with established fields of research and professional practice.