Europe’s AI Sovereignty Stack

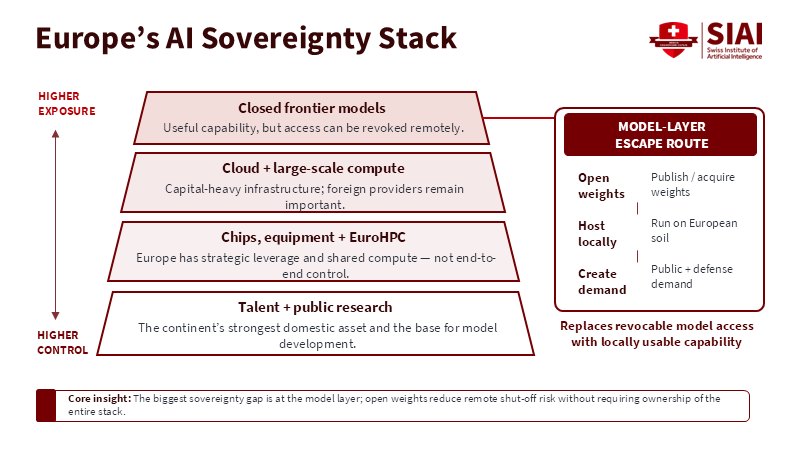
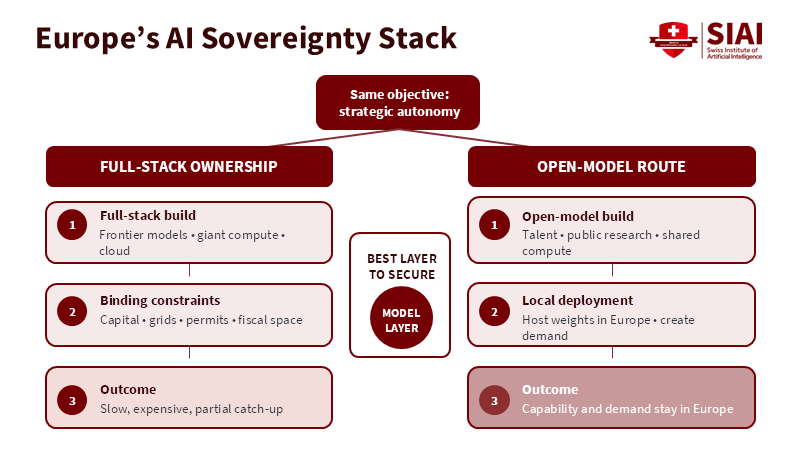
Europe’s AI Sovereignty Stack

Picture

Member for

2 years
Real name
SIAI Chart
Bio
SIAI Chart

Modified

Figure 1: Two routes to the same goal, with very different capital requirements.

Related article: Europe in the AI Value Chain: Little Capital, a Lot of Talent and the Choice of Open Weights

Picture

Member for

2 years
Real name
SIAI Chart
Bio
SIAI Chart

Two Routes to European AI Sovereignty

Two Routes to European AI Sovereignty

Picture

Member for

2 years
Real name
SIAI Chart
Bio
SIAI Chart

Modified

Figure 2: The model layer carries the exposure that infrastructure spending cannot remove.

Related article: Europe in the AI Value Chain: Little Capital, a Lot of Talent and the Choice of Open Weights

Picture

Member for

2 years
Real name
SIAI Chart
Bio
SIAI Chart

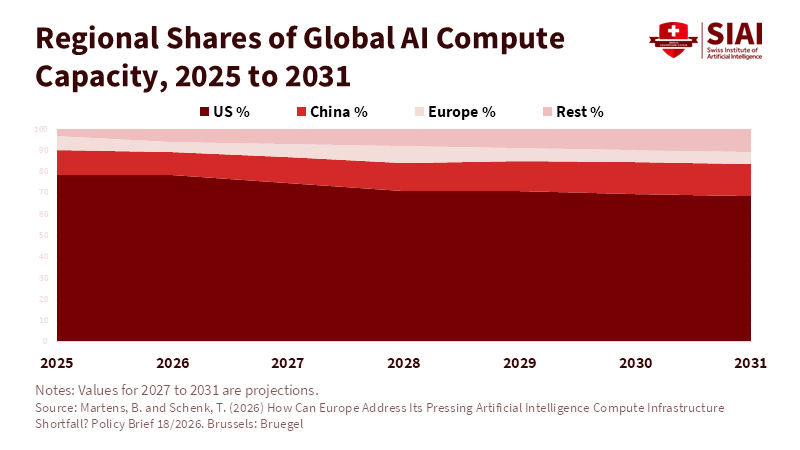
Regional Shares of Global AI Compute Capacity, 2025 to 2031

Regional Shares of Global AI Compute Capacity, 2025 to 2031

Picture

Member for

2 years
Real name
SIAI Chart
Bio
SIAI Chart

Modified

Figure 8. China gains share while Europe stays near 6 percent.

Related article: Europe in the AI Value Chain: Fiscal Limits, Untapped Talent and the Case for Open Weights

Picture

Member for

2 years
Real name
SIAI Chart
Bio
SIAI Chart

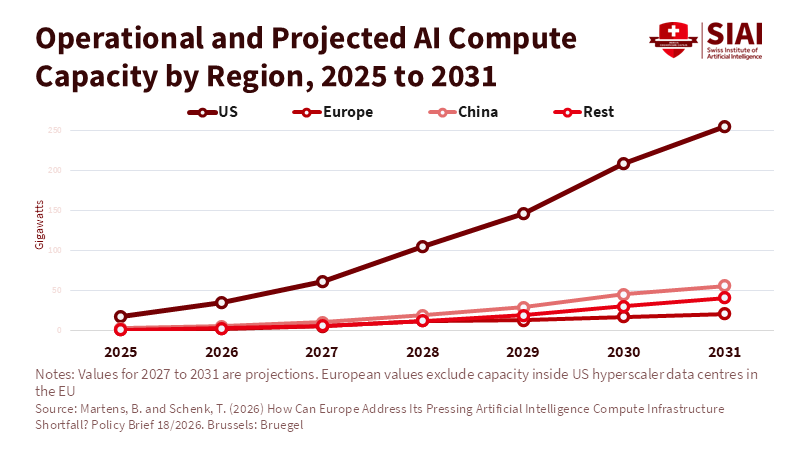
Operational and Projected AI Compute Capacity by Region, 2025 to 2031

Operational and Projected AI Compute Capacity by Region, 2025 to 2031

Picture

Member for

2 years
Real name
SIAI Chart
Bio
SIAI Chart

Modified

Figure 1. Europe's capacity grows tenfold but stays far behind.

Related article: Europe in the AI Value Chain: Fiscal Limits, Untapped Talent and the Case for Open Weights

Picture

Member for

2 years
Real name
SIAI Chart
Bio
SIAI Chart

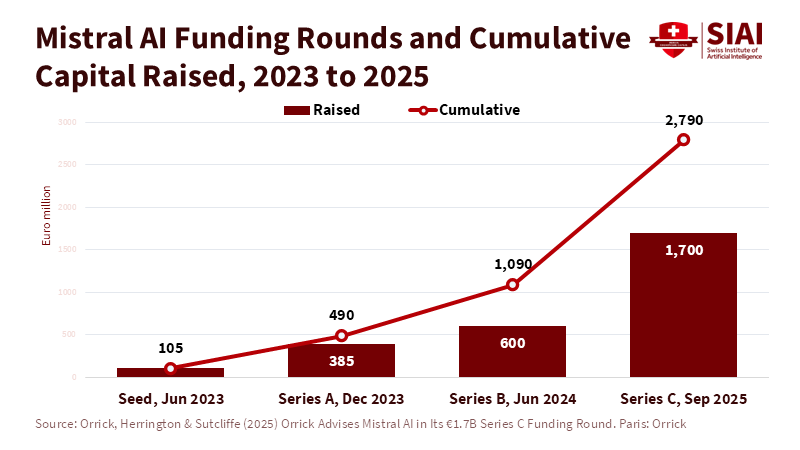
Mistral AI Funding Rounds and Cumulative Capital Raised, 2023 to 2025

Mistral AI Funding Rounds and Cumulative Capital Raised, 2023 to 2025

Picture

Member for

2 years
Real name
SIAI Chart
Bio
SIAI Chart

Modified

Figure 7. One 2025 round exceeded all earlier funding combined.

Related article: Europe in the AI Value Chain: Fiscal Limits, Untapped Talent and the Case for Open Weights

Picture

Member for

2 years
Real name
SIAI Chart
Bio
SIAI Chart

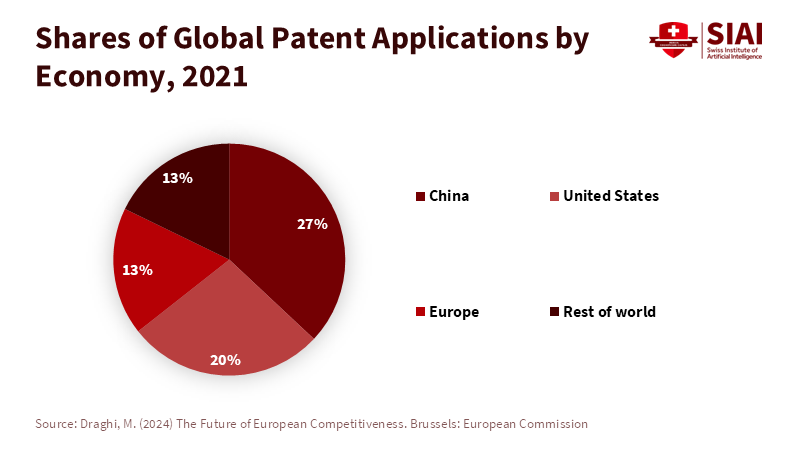
Shares of Global Patent Applications by Economy, 2021

Shares of Global Patent Applications by Economy, 2021

Picture

Member for

2 years
Real name
SIAI Chart
Bio
SIAI Chart

Modified

Figure 6. Europe files patents at close to U.S. levels.

Related article: Europe in the AI Value Chain: Fiscal Limits, Untapped Talent and the Case for Open Weights

Picture

Member for

2 years
Real name
SIAI Chart
Bio
SIAI Chart

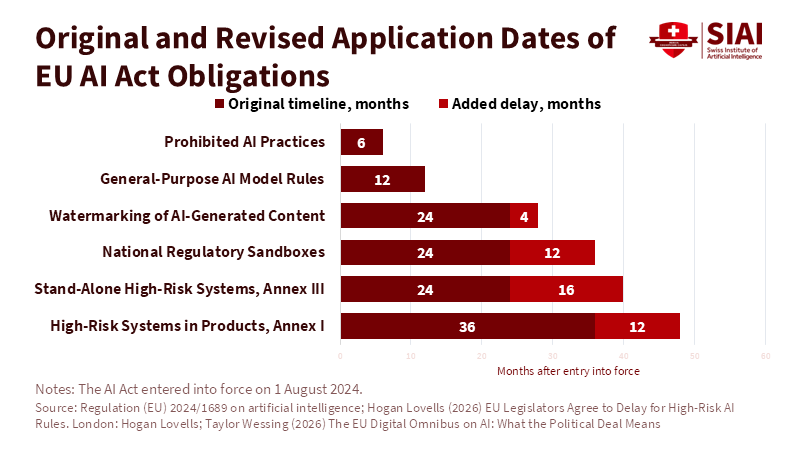
Original and Revised Application Dates of EU AI Act Obligations

Original and Revised Application Dates of EU AI Act Obligations

Picture

Member for

2 years
Real name
SIAI Chart
Bio
SIAI Chart

Modified

Figure 5. High-risk rules slipped by up to sixteen months.

Related article: Europe in the AI Value Chain: Fiscal Limits, Untapped Talent and the Case for Open Weights

Picture

Member for

2 years
Real name
SIAI Chart
Bio
SIAI Chart

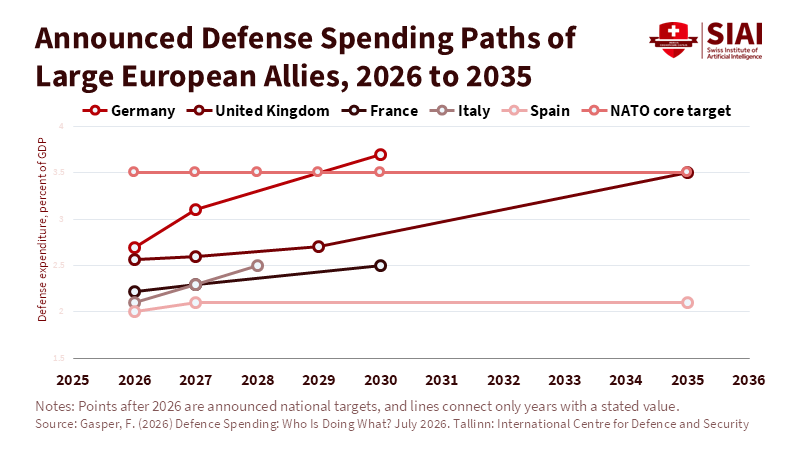
Announced Defense Spending Paths of Large European Allies, 2026 to 2035

Announced Defense Spending Paths of Large European Allies, 2026 to 2035

Picture

Member for

2 years
Real name
SIAI Chart
Bio
SIAI Chart

Modified

Figure 4. Only Germany and the UK plan paths to 3.5 percent.

Related article: Europe in the AI Value Chain: Fiscal Limits, Untapped Talent and the Case for Open Weights

Picture

Member for

2 years
Real name
SIAI Chart
Bio
SIAI Chart