
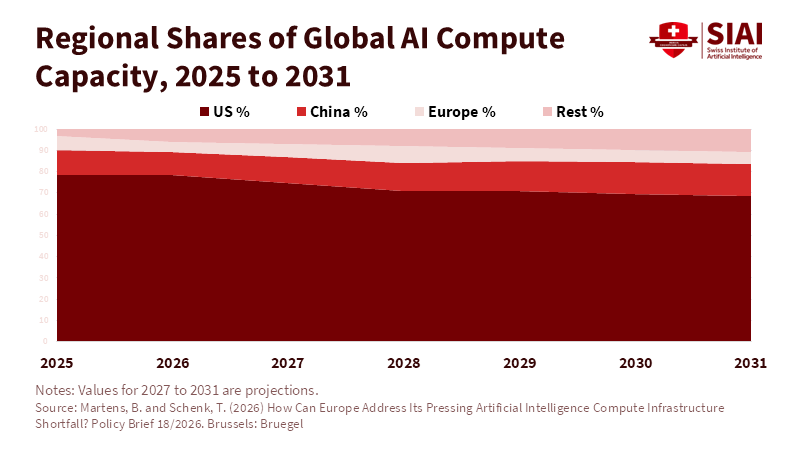
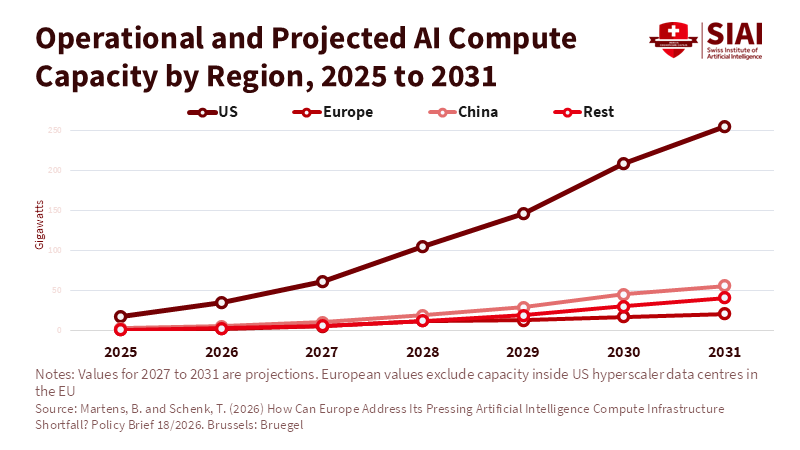
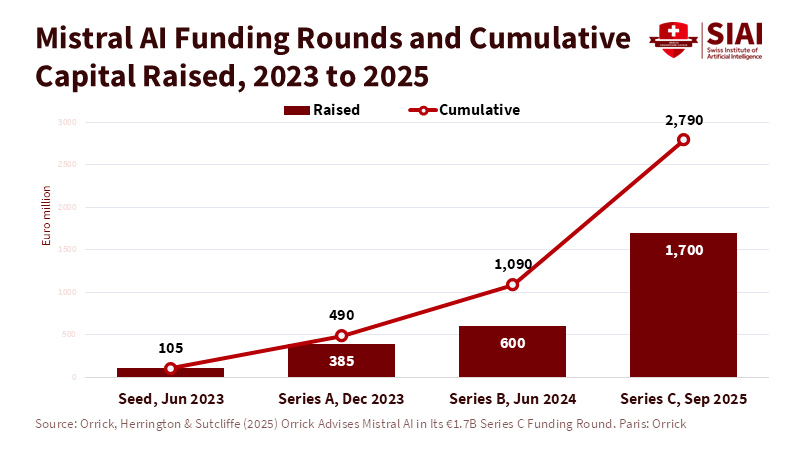
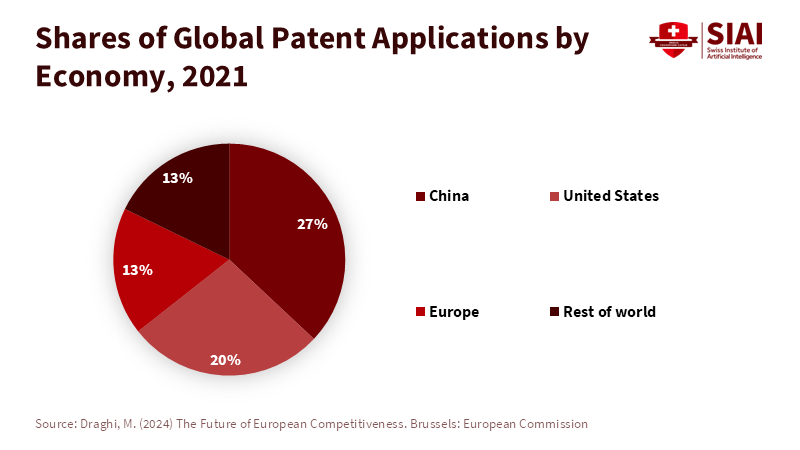
Figure 6. Europe files patents at close to U.S.
Read More








Figure 2. Three U.S.
Read More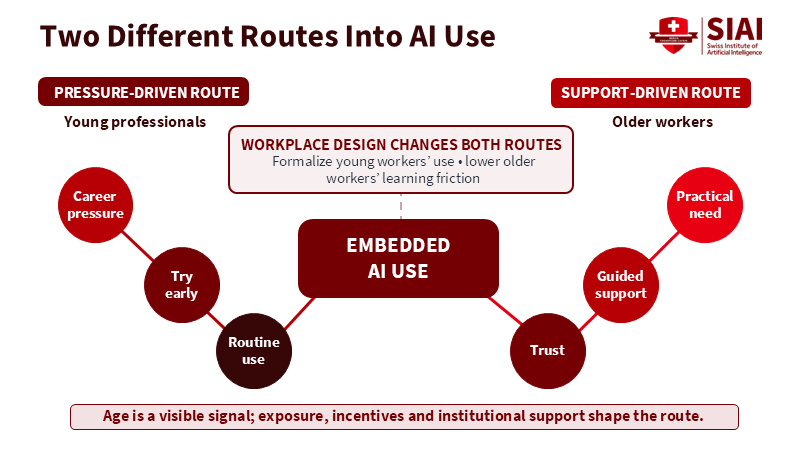
Figure 1: Different pressures can lead both generations toward embedded AI use. Related article: Generational Gap
Read More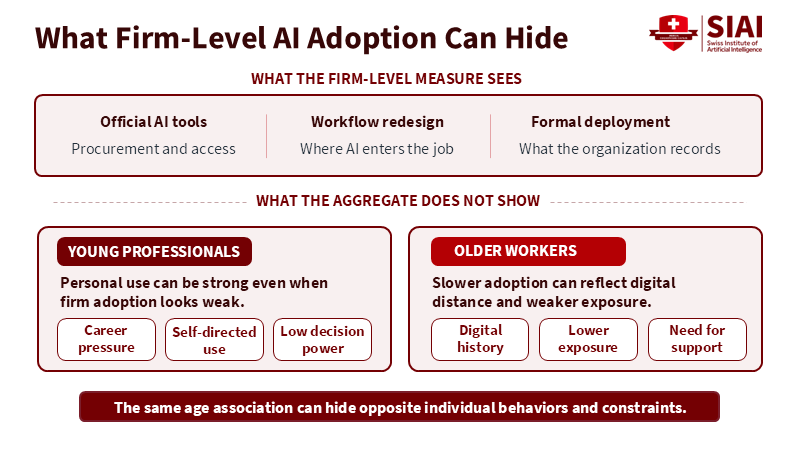
Figure 2: Aggregate adoption can conceal very different barriers and incentives by age. Related article: Generation
Read More
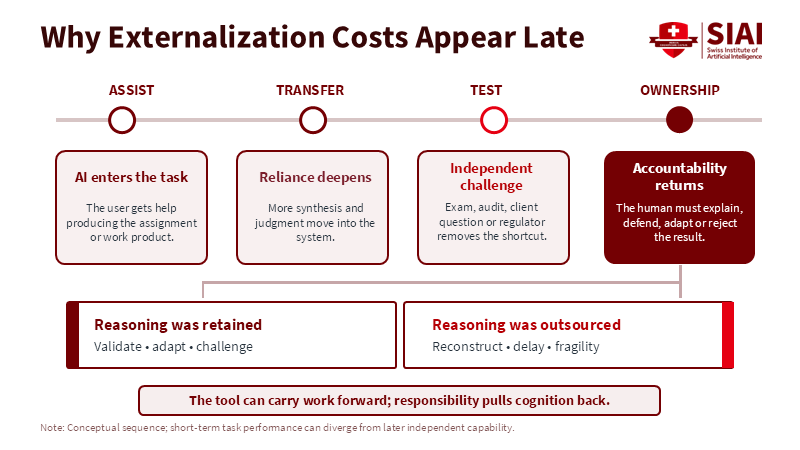
Figure 2: Externalized reasoning becomes visible when independent performance or accountability returns.
Read More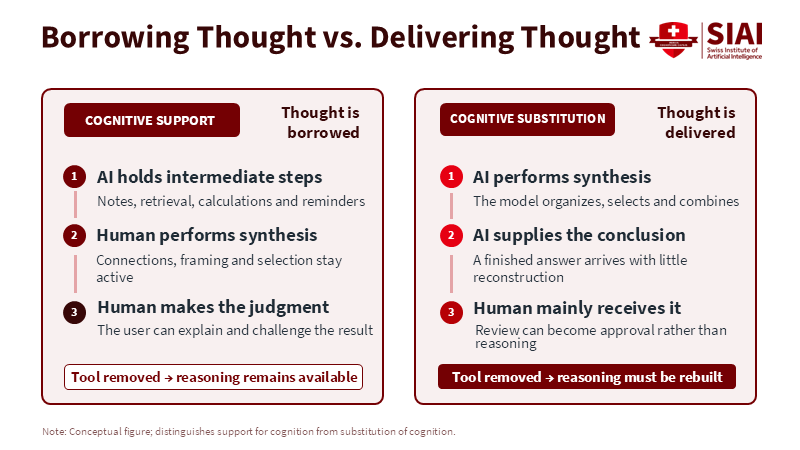
Figure 1: AI can reduce cognitive load without replacing synthesis and judgment. Related article: AI Cognitive
Read More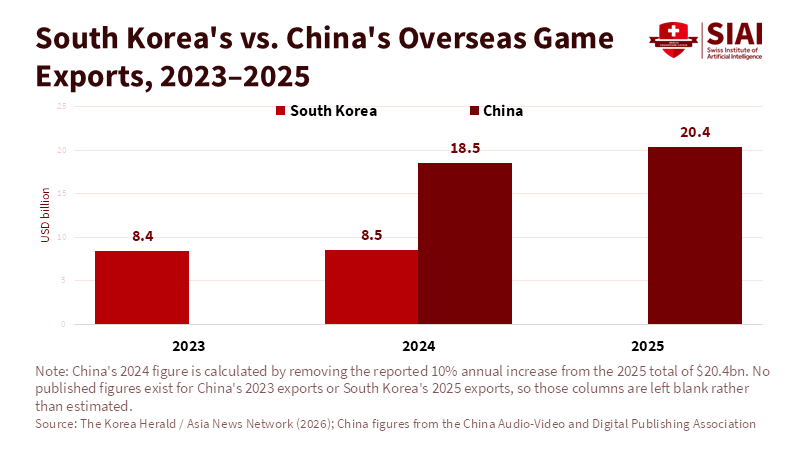
Figure 2: Export growth diverges sharply after 2023 despite similar starting points. Related article: What Kor
Read More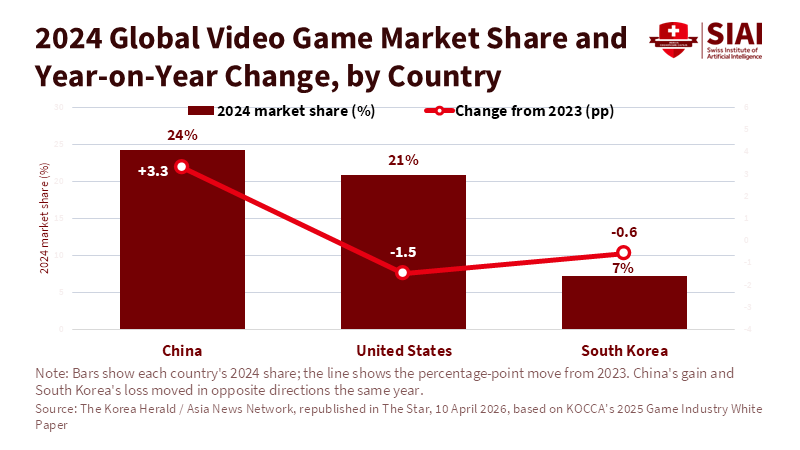
Figure 1: China's 2024 gain and South Korea's loss moved in opposite directions the same year. Related article: Wh
Read More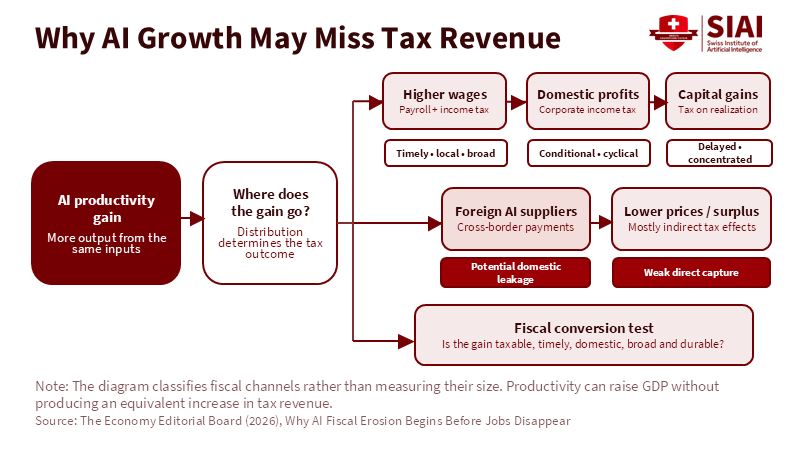
Figure 1: Where AI productivity gains land determines whether they ever become tax revenue — wage and domestic-profit channels convert relatively quickly, cross-border and capital-gains channels barely convert at all.
Read More
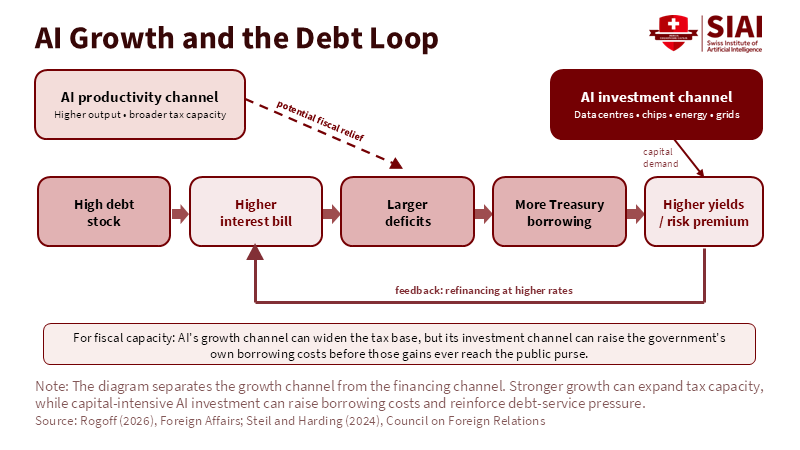
Figure 1: AI's growth channel can widen the tax base, while its investment channel can raise the government's own borrowing costs before those gains are realized. Related article:
Read More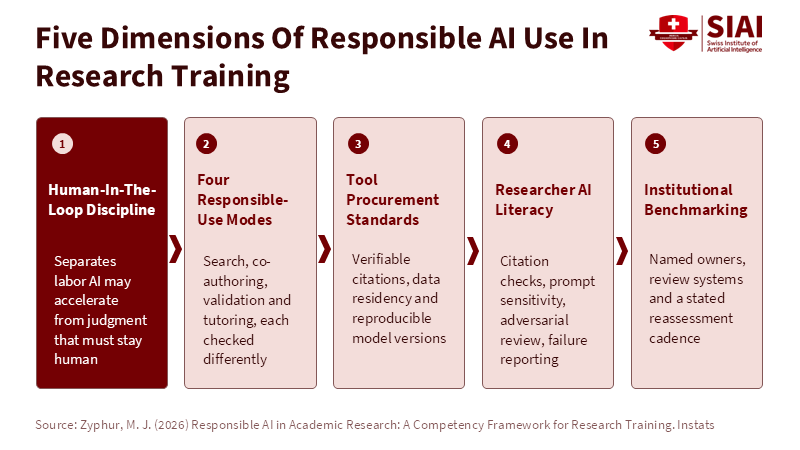
Figure 1: Only six of the thirty-eight doctoral universities studied had progressed through all five dimensions; fifteen remained at a generic conduct-rule stage. Related article:
Read More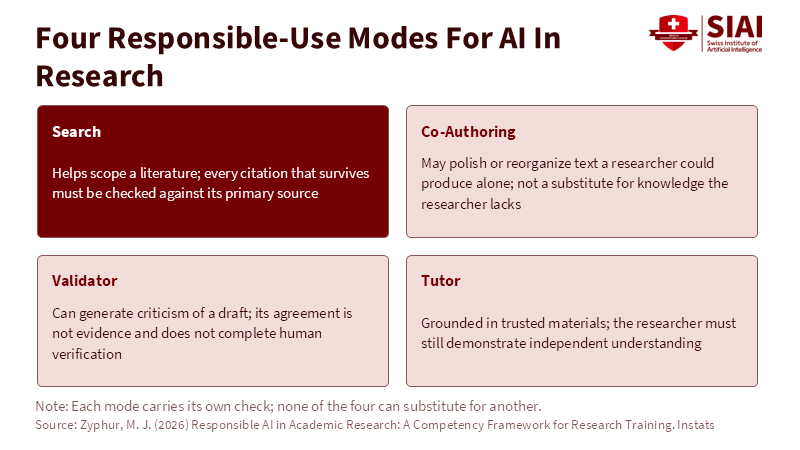
Figure 1: Zyphur’s framework distinguishes search, co-authoring, validator, and tutor functions, showing that each mode requires a different form of human verification and oversight. Related article:
Read More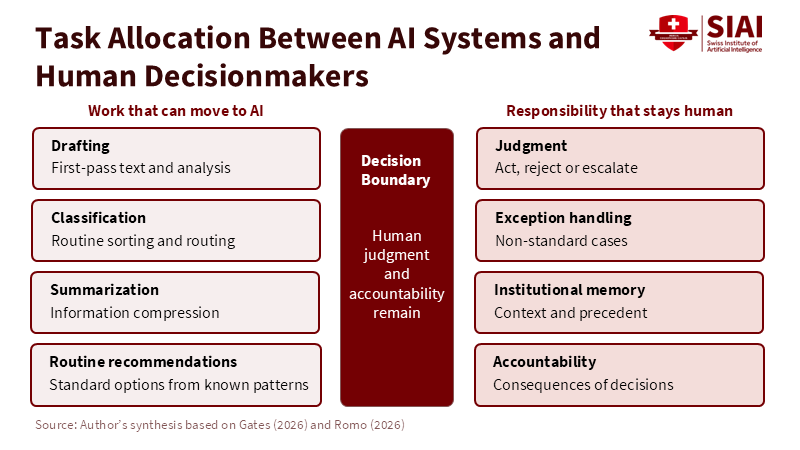
Figure 1: Routine production can shift to AI while judgment and accountability remain human. Related article: [AI Labor vs.
Read More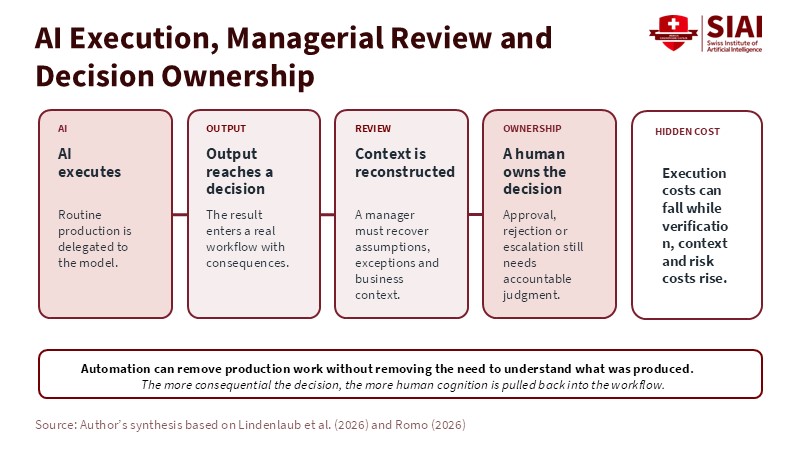
Figure 1: AI can reduce execution costs while shifting work into review and decision ownership. Related article: [AI Labor vs.
Read More