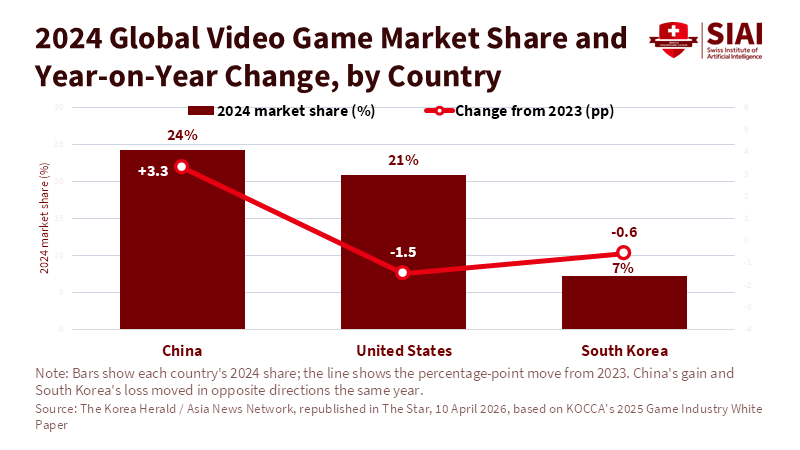
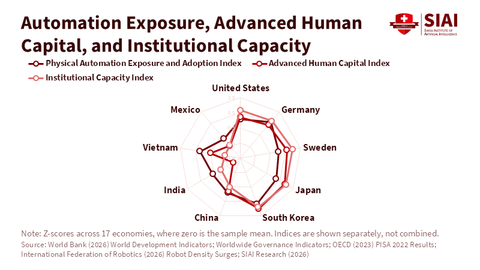
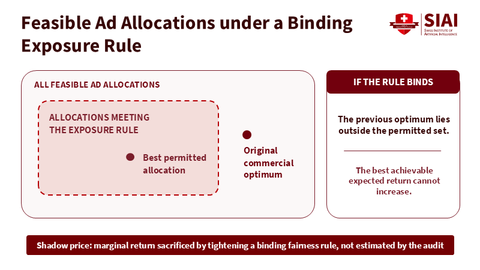
2024 Global Video Game Market Share and Year-on-Year Change, by Country Picture Member for 2 years Real name SIAI Chart Bio SIAI Chart Input Sep 9, 2026 02:27 Modified Sep 9, 2026 02:34 Figure 1: China's 2024 gain and South Korea's loss moved in opposite directions the same year. Related article: What Korea's Gaming Curfew Reveals About Meta's Two-Hour Limit Picture Member for 2 years Real name SIAI Chart Bio SIAI Chart Previous Why AI growth may miss tax revenue Next South Korea's vs. China's Overseas Game Exports, 2023–2025 Similar Post Nov 5, 2026 07:34 Robot Installations and Physical Al Diffusion Paths, 2020-2036 Nov 5, 2026 07:34 Tax Revenue Relative to the No-Al Path by Scenario and Economy, 2036 Nov 5, 2026 07:34 Foundational Skills, Researcher Density, and Research Intensity by Economy Nov 5, 2026 07:34 Human Labor Cost and Robotic Break-Eve Cost by Economy, 2029 and 2036 Nov 5, 2026 07:34 Labor Requirements by Productivity Gain and Demand Elasticity Nov 5, 2026 07:34 Public Debt Relative to the No-Al Path by Scenario and Economy, 2036 Nov 5, 2026 07:34 Outcomes of Displaced Workers by Scenario and Economy, 2036 Nov 5, 2026 07:34 Automation Exposure, Advanced Human Capital, and Institutional Capacity wf Dhucical Antamation Evynnacure and Institutional Capacity Nov 4, 2026 02:00 Feasible Ad Allocations under a Binding Exposure Rule