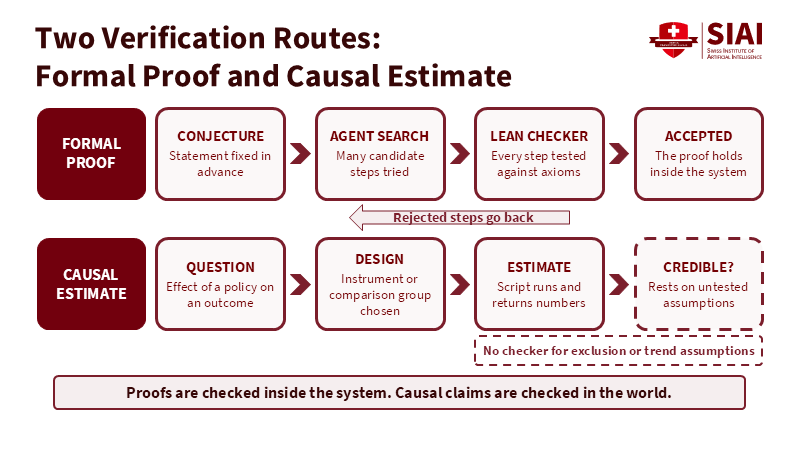
Figure: The proof route ends at a checker; the causal route ends at untested assumptions. Related articles: Why AI’s Navier-Stokes Proof Is Not Causal R
Read More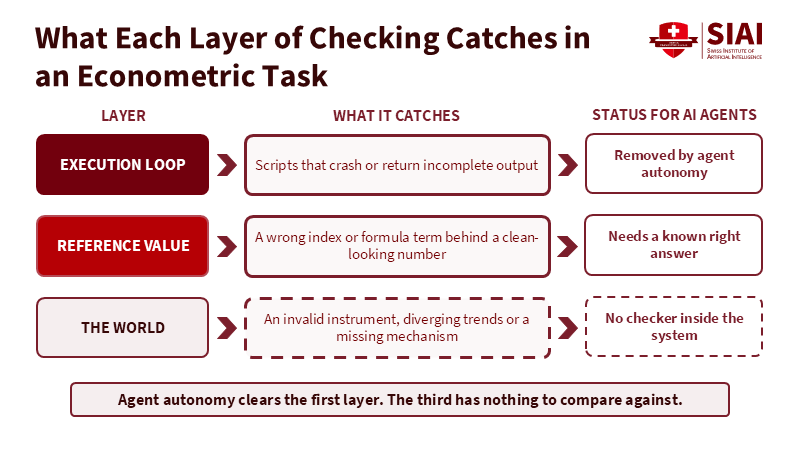
Figure: Agent autonomy clears crashes, but identification failures meet no checker. Related articles: Why AI’s Navier-Stokes Proof Is Not Causal Reason
Read More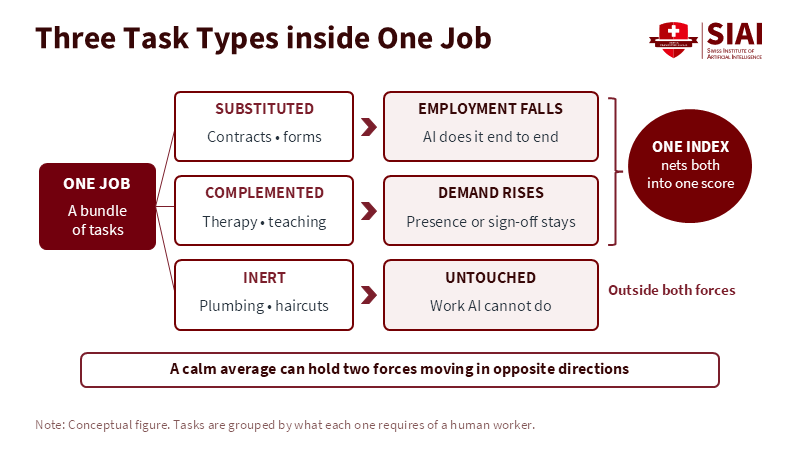
Figure 1: Substitution and complementarity pull in opposite directions inside the same job and a single exposure score adds them together. Related article:
Read More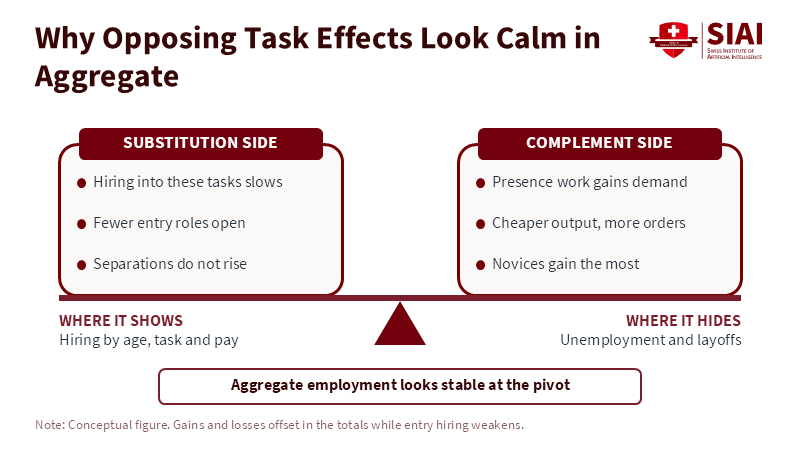
Figure 2: Losses and gains balance in the totals, so the change shows up in who gets hired, not in the unemployment rate. Related article:
Read More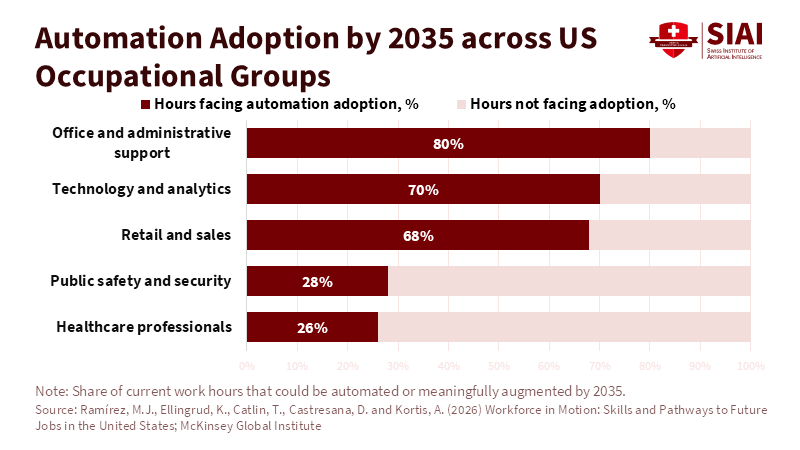
Figure 1: Office support faces three times the automation exposure of healthcare professionals, which is why the first losses land on desks rather than wards. Related article:
Read More







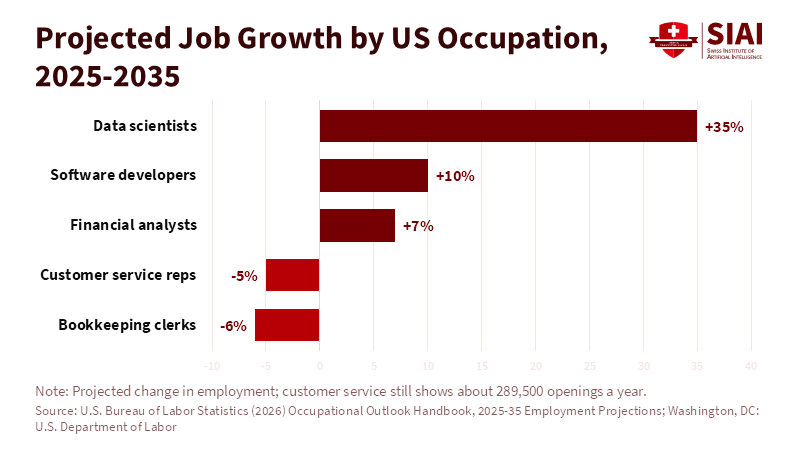
Figure 2: Roles that work with AI outputs are growing while first-draft roles shrink and the gap between them is about 40 points. Related article:
Read More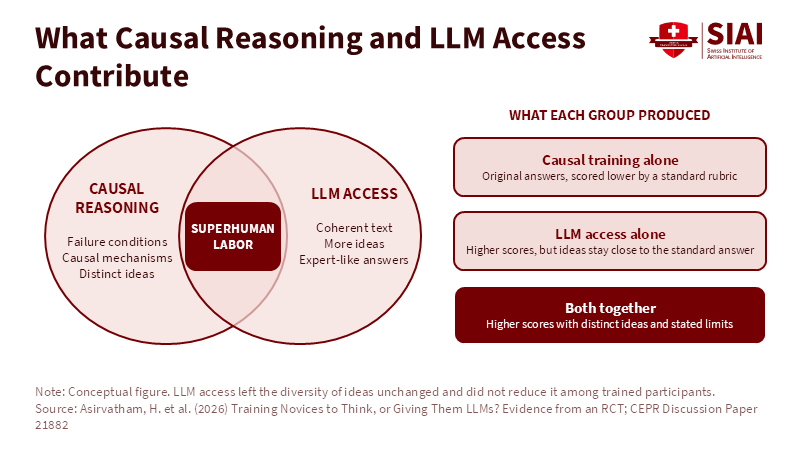
Figure 1: Each input supplies what the other lacks; only the overlap delivers both scores and originality. Related article:
Read More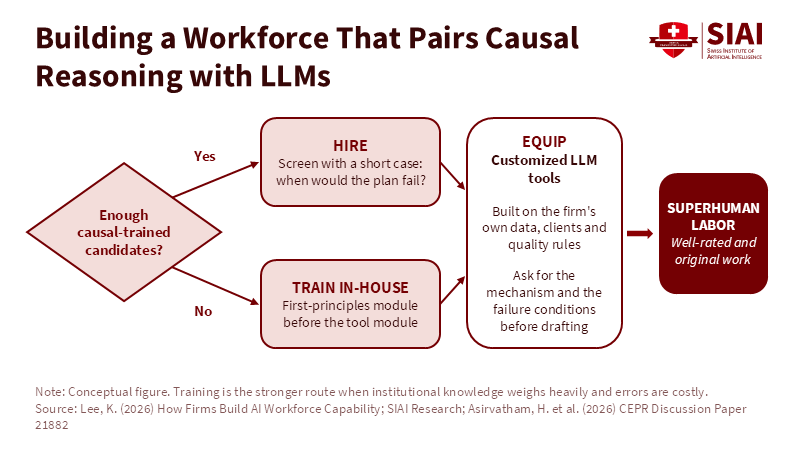
Figure 2: Hiring and in-house training feed the same customized tool layer. Related article: Superhuman Labor: Hiring, Tr
Read More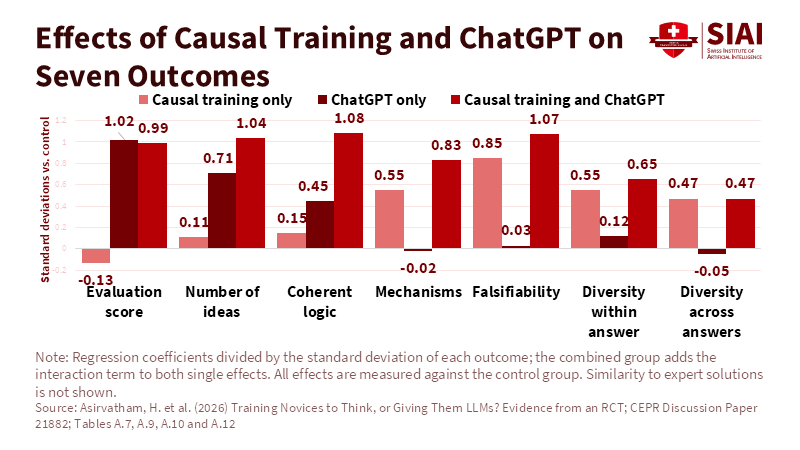
Figure 1: ChatGPT lifts scores; only the trained reasoning moves mechanisms and falsifiability. Related article:
Read More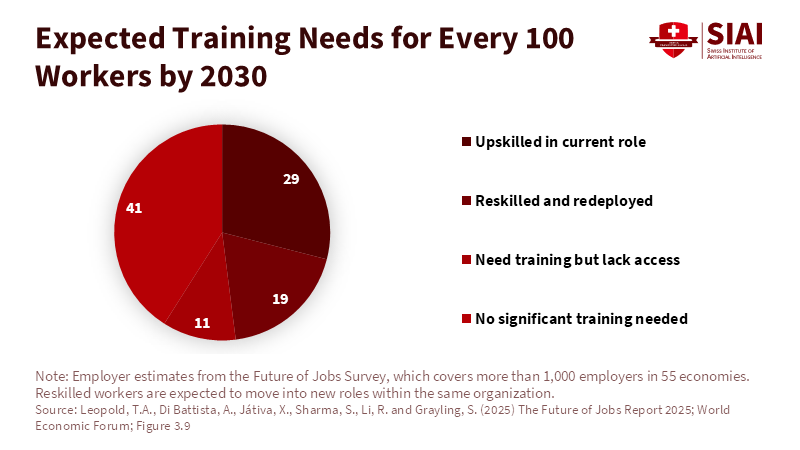
Figure 2: Employers expect to retrain nearly half their workforce in place rather than replace it. Related article:
Read More
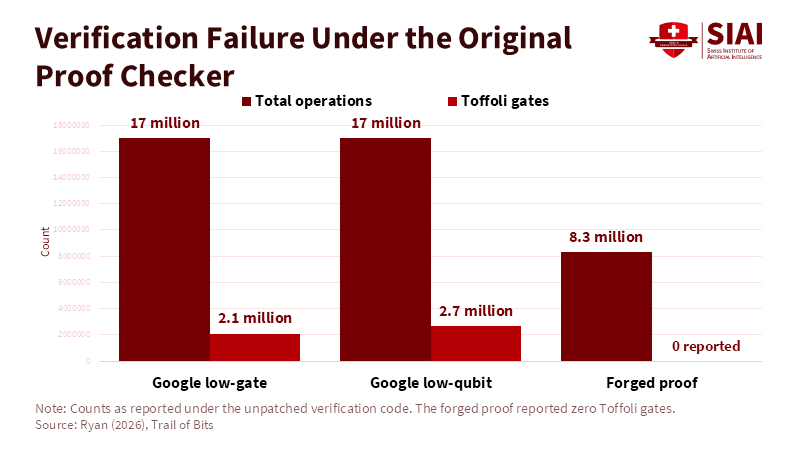
Figure 1: A forged proof reported zero Toffoli gates and under half the operations, and the unpatched checker accepted it. Related article:
Read More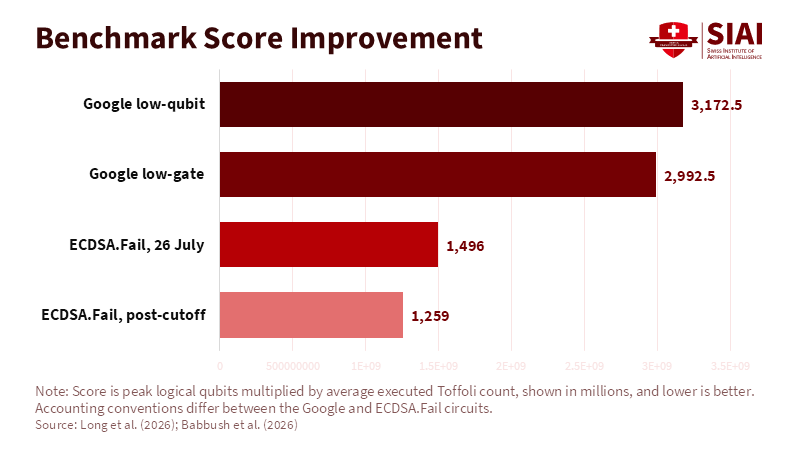
Figure 2: Circuits from the public leaderboard score about half of Google's disclosed points or lower, under different accounting conventions. Related article:
Read More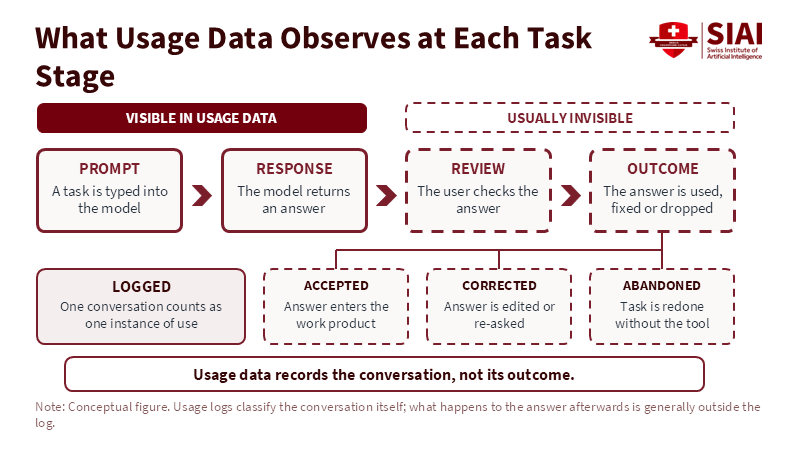
Figure 2: Logs capture the prompt and response, while acceptance, correction and abandonment happen out of view. Related article:
Read More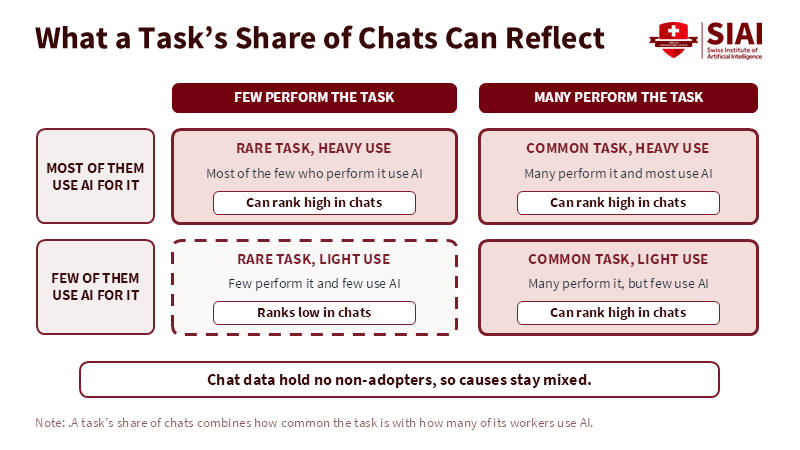
Figure 1: A high chat share can come from a common task, heavy use, or both, and chat data cannot say which. Related article:
Read More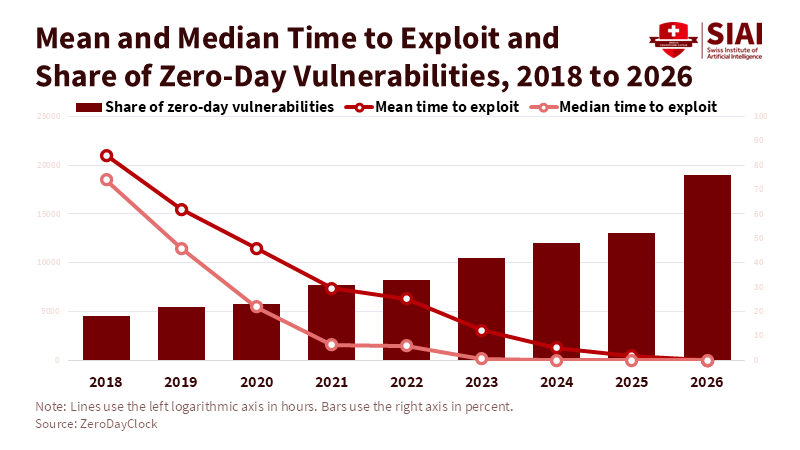
Figure 1: Mean time to exploit dropped below ten hours in 2026 as the share of zero-day vulnerabilities reached about three-quarters. Related article:
Read More
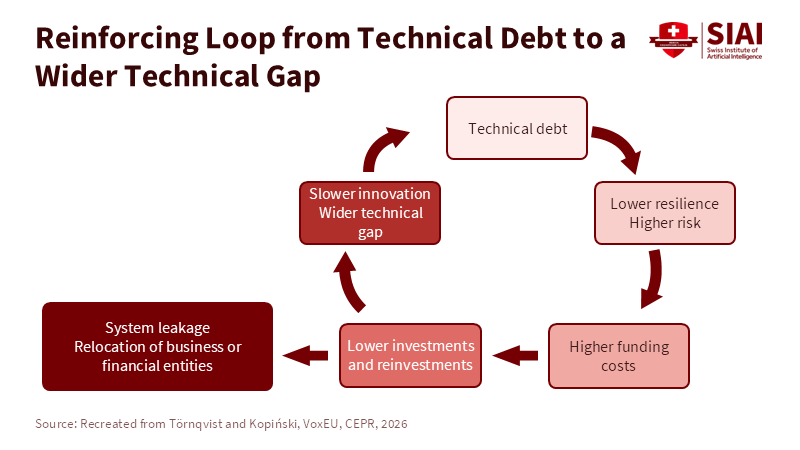
Figure 2: Each round of weaker defence raises funding costs and cuts reinvestment, which widens the gap that started the loop. Related article:
Read More