Bid Low, Renegotiate Later: Why Education Procurement Must Break the Lowball Trap
Easy renegotiation encourages lowball bids
Costs rise later through change orders while value stays flat
Use formula-based indexation, strict correction rules, and transparent amendment data

When the Feed Is Poisoned, Only Proof Can Heal It
When the Feed Is Poisoned, Only Proof Can Heal It

In recent years, his research has extended to the economic and fiscal implications of technological change, including the interaction between artificial intelligence, demographic shifts, and public finance sustainability.
He holds a PhD in Mathematical Finance from Boston University, and previously earned an MSc in Finance and Economics from the London School of Economics. He completed his undergraduate studies in Economics at Seoul National University under the Korea Foundation for Advanced Studies scholarship program.
He regularly contributes analytical essays on the broader socioeconomic implications of AI to The Economy Review.
Published
Modified
Trusted news wins when fakes surge
Make “proof” visible—provenance, corrections, and methods—not just better detectors
Adopt open standards and clear labels so platforms, schools, and publishers turn credibility into a product feature

By mid-2025, trust in news is about 40% across 48 countries. This figure has remained steady for three years, even as more people get their news from quick, engaging social video. In 2020, 52% of people consumed news via social video; this year, it’s 65%. The amount of content has surged, but trust has not. This stagnation presents an opportunity for policy change. When audiences confront the reality of AI-generated misinformation, they do not just feel despair; many turn to transparent brands—those where the source, corrections, and accountability are transparent, verifiable, and consistent. In the coming decade, news strategy will depend less on the best detection models and more on making “trust” a visible and verifiable product feature. In a media landscape flooded with low-quality content, credibility becomes rare, and scarcity drives up its value.
While the battle against misinformation is often likened to a race, with better detection tools pitted against more convincing fakes, it's crucial to remember that this race is not the only strategy. Branding, the public promise of methods and standards, takes center stage. If the public often verifies questionable claims by turning to “a news source I trust,” then policy should encourage newsrooms to compete on proof, not just on speed or scale. A brand becomes more than just a logo; it becomes a reliable process, a record of corrections, and a consistent user experience that helps readers quickly identify what is original, what is fake, and what has been confirmed. This is the potential of branding, turning today’s anxiety into future loyalty and hope for a more credible media landscape.
The Scarcity Premium of Trust
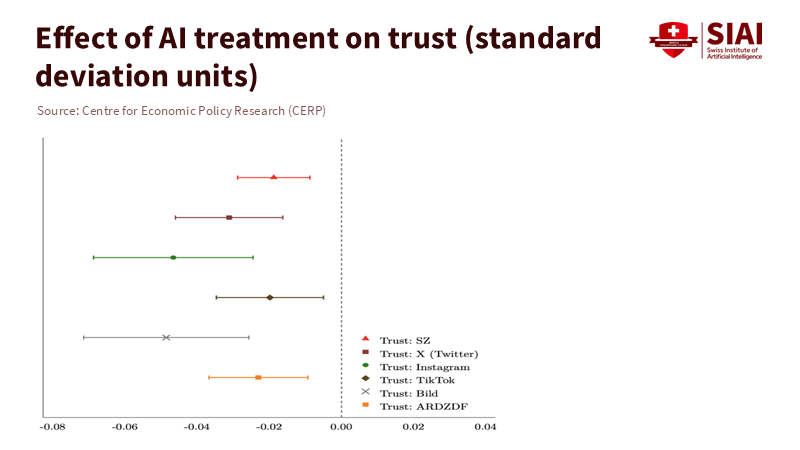
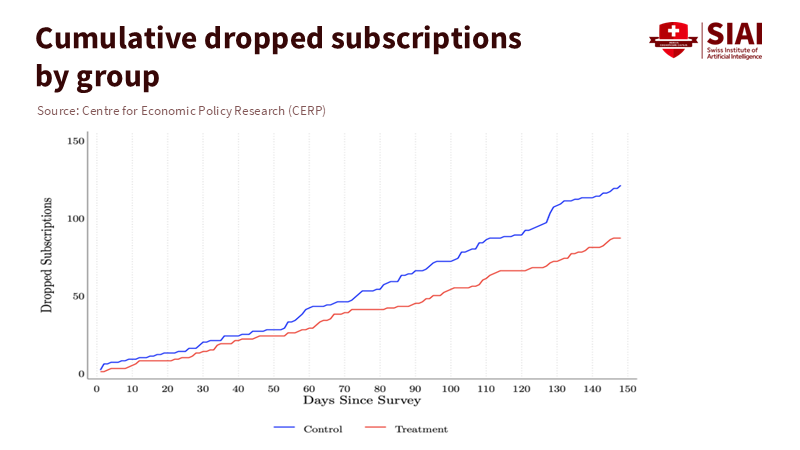
Recent evidence from Germany supports this idea. In an experiment with Süddeutsche Zeitung, readers were shown a message highlighting how difficult it is to distinguish authentic images from AI-generated ones. The immediate result was mixed: concern about misinformation increased by 0.3 standard deviations, and trust in news dropped by 0.1 s.d., even for SZ itself; however, behavior diverged from sentiment. In the days following this exposure, daily visits to SZ rose by about 2.5%. Five months later, subscriber retention was 1.1% higher—a one-third drop in churn. This means that when the danger of fake content becomes clear, the value of a brand that helps users sort truth from falsehood increases, and some readers reward that brand with their time and money. Method note: these effects are intention-to-treat estimates from random assignment; browsing and retention are actual outcomes, not self-reports.
This pattern reflects broader audience behavior. The Reuters Institute’s 2025 report shows overall trust remaining around 40%, with more people turning to social video. Critically, “a news source I trust” emerged as the top source for verifying questionable claims (38%), far ahead of AI tools. For policymakers and publishers, this means they should not abandon AI, but should focus editorial investment on what the public already uses to determine what is real: brand reputation and clear standards. When credibility is rare, its value—in terms of visits, retention, and willingness to pay—increases when contamination is evident. The market signal is clear: compete on credibility, not just on the volume of content. This emphasis on the importance of competition in establishing credibility motivates the audience to contribute to a more trustworthy media environment.
Branding as Infrastructure, Not Cosmetics
If branding is to play a bigger role, it cannot be superficial. It must be foundational: provenance by default, easy-to-find corrections, and apparent human oversight. Progress is being made in adopting open standards. The Coalition for Content Provenance and Authenticity (C2PA) is establishing a growing ecosystem: Adobe’s Content Authenticity Initiative surpassed 5,000 members this year; camera makers like Leica now produce devices that embed Content Credentials; major platforms are testing labels based on provenance; and many newsrooms have pilot projects underway. Policy plays a crucial role in fostering this progress by tying subsidies, tax breaks, or public-interest grants to the use of open provenance standards in editorial processes. This emphasis on policy reassures the audience about the potential for change and improvement in the media landscape.
The risks we are trying to manage are no longer hypothetical. A recent comparative case study documents how AI-generated misinformation manifests differently across countries and formats—voice cloning in UK politics, image manipulation and re-contextualization in German protests, and synthetic text and visuals fueling rumors on Brazilian social platforms. Fact-checkers in all three contexts identified similar challenges: the rapid spread on closed or semi-closed networks, the difficulty of proving something is fake after initial exposure, and the resource drain of repeated debunks. A nicer homepage will resolve none of these issues. They will be addressed when the brand promise is linked to verifiable assets: persistent Content Credentials for original content, a real-time correction index where changes are timestamped and signed, and explanations of the reporting that clarify methods, sources, and known uncertainties. Those features transform a brand into a tool for the public.
Remove the Fuel: Labeling, Friction, and Enforcement
A second key element lies outside the newsroom: platform and regulatory policies that reduce the spread of synthetic hoaxes without limiting legitimate speech. China’s new labeling law, effective September 1, 2025, requires that AI-generated text, images, audio, and video have visible labels and embedded metadata (watermarks) on major platforms like WeChat, Douyin, Weibo, and Xiaohongshu, with enforcement by the Cyberspace Administration of China. Regardless of opinions about Chinese information controls, the technical basis is transferable and straightforward: provenance should accompany the file, and platforms should display it by default. Democracies may not—or should not—replicate this speech structure. Still, they can adopt the infrastructure: standardized labels, consistent user interfaces, penalties for deceptive removal of credentials, and transparency reports on mislabeled content.
A democratic version would include three components. First, defaults: platforms would auto-display Content Credentials when available and encourage uploaders to attach them, particularly for political ads and news-related content. Second, targeted friction: when provenance is missing or altered on high-risk content, the system would slow its spread—reducing algorithmic boosts, limiting sharing, and providing context cards that direct users to independent sources. Third, accountability: fines or removals for commercial entities that strip credentials or mislabel synthetic assets, with safe harbors for satire, art, and protected speech that are clearly labeled. This is not an abstract wish list. Standards are available, adoption is increasing, and the public has indicated that when they doubt something, they go to a trusted source. Policy should help more outlets earn that trust.
The education sector has a specific role. Students, teachers, and administrators now interact with AI in various aspects of their information consumption, from homework help to campus rumors. Curricula can be adapted quickly to include lessons on provenance literacy alongside traditional media literacy, such as how to read a Content Credential, verify if a photo has a signature, and differentiate between verified and unverifiable edits. Procurement guidelines for schools and universities can require C2PA-compatible tools for communications teams. Public institutions can create “trust labs” that collaborate with local news organizations to determine which user interface cues—labels, bylines, correction banners—help different age groups distinguish real from synthetic. The goal is not to transform everyone into a forensic expert, but to make the brand signals of trustworthy outlets clear and to teach people how to use them.
Critics may raise several objections. Labels and watermarks can be removed or forged. This is true. However, open standards make removal detectable, and the goal is not perfection; it’s to make truth easier to verify and lies more costly to maintain. Others may argue that provenance favors large incumbents. It might—if adoption costs are high or if the standards are proprietary. That is why policy should support open-source credentialing tools for small and local newsrooms and tie public advertising or subsidies to their use. Skeptics may also claim that audiences will not care. The German experiment suggests otherwise: the visibility of AI fakes diminished self-reported trust but also encouraged real engagement and retention with a trustworthy outlet. Establish the framework, and usage will follow. Finally, some may argue that this focus is misplaced; the real issue is not isolated deepfakes but the constant stream of low-effort misinformation. The solution is both: provenance helps catch serious fraud, and clear brand signals assist audiences in quickly filtering out low-level noise.
The final objection comes from those who seek a purely technological solution. However, audiences have consistently indicated in surveys that they feel uneasy about AI-generated news and would prefer to verify claims through sources they already trust. Detection will improve—and should—but making trust apparent is something we can address today. Practically, this means newsrooms must commit to providing user-facing proof: ongoing Content Credentials for original content, a permanent corrections index, and explanations outlining what we know, what we don’t, and how we know it. It also involves setting platform defaults that promote these signals and regulatory measures that penalize deceptive removal or misuse. The aim is not to outsmart the fakers; it’s to out-communicate them.
We began with a persistent statistic—40% trust—against the backdrop of increasing social-video news consumption and an overflow of synthetic content. We conclude with a practical approach: compete on proof. The German experiment shows that when the threat is made clear, trustworthy brands can maintain and even grow audience attention. The public already turns to trusted outlets when facts are uncertain. Standards like C2PA give us the technical basis to ensure authenticity is portable. Even the most rigorous labeling systems being introduced abroad provide a simple lesson: provenance should go with the file and be displayed by default. If education systems, platforms, and publishers work together around these signals, we can regain ground without silencing discussions or expecting extraordinary vigilance from every reader. The cost of fabrication has dropped near zero. The value of trust, however, remains high. Let’s create brands, products, and policies that make that value clear and, even better, easy to choose.
The views expressed in this article are those of the author(s) and do not necessarily reflect the official position of the Swiss Institute of Artificial Intelligence (SIAI) or its affiliates.
References
Adobe (Content Authenticity Initiative). (2025, August 8). 5,000 members: Building momentum for a more trustworthy digital world.
Campante, F., Durante, R., Hagemeister, F., & Sen, A. (2025, August 3). GenAI misinformation, trust, and news consumption: Evidence from a field experiment (CEPR Discussion Paper No. 20526). Centre for Economic Policy Research.
Cazzamatta, R. (2025, June 11). AI-Generated Misinformation: A Case Study on Emerging Trends in Fact-Checking Practices Across Brazil, Germany, and the United Kingdom. Journalism & Mass Communication Open, SAGE.
Coalition for Content Provenance and Authenticity (C2PA). (n.d.). About C2PA.
GiJN. (2025, July 10). 2025 Reuters Institute Digital News Report: Eroding public trust and the rise of alternative ecosystems. Global Investigative Journalism Network.
Reuters Institute for the Study of Journalism. (2025, June 17). Digital News Report 2025 (Executive summary & full report). University of Oxford. https://reutersinstitute.politics.ox.ac.uk/digital-news-report/2025
SCMP. (2025, September 1). China’s social media platforms rush to abide by AI-generated content labelling law. South China Morning Post.
Thomson Reuters. (2024, June 16). Global audiences suspicious of AI-powered newsrooms, report finds. Reuters.
Thomson Reuters. (2025, March 14). Chinese regulators issue requirements for the labeling of AI-generated content. Reuters.
VoxEU/CEPR. (2025, September 16). AI misinformation and the value of trusted news.
In recent years, his research has extended to the economic and fiscal implications of technological change, including the interaction between artificial intelligence, demographic shifts, and public finance sustainability.
He holds a PhD in Mathematical Finance from Boston University, and previously earned an MSc in Finance and Economics from the London School of Economics. He completed his undergraduate studies in Economics at Seoul National University under the Korea Foundation for Advanced Studies scholarship program.
He regularly contributes analytical essays on the broader socioeconomic implications of AI to The Economy Review.


Wires Before Watts: What Spain's Blackout Teaches Schools About Energy Security
Spain’s blackout showed solar alone doesn’t keep schools on
Campuses need batteries, islanding inverters, and wiring upgrades
Shift policy from price relief to resilience built in schools

In 2024, Spain generated 56.8% of its elect
The Case for “Designed Stress”: Why Later, Flexible Retirement Can Add Years to Life
Eustress—purposeful, controllable challenge—appears to extend healthspan
Evidence from royal lifespans and modern biology suggests agency under load, not early exit, supports longevity
Replace hard retirement cutoffs with flexible, late-career roles that maximize autonomy, mentoring, and recovery

When Tariffs Teach: Why Diversification Is Now an Education Policy Problem
Tariff shocks don’t halt trade—they reroute it, reshaping supply chains
Those shifts hit education budgets, curricula, and partnerships, demanding “diversification-ready” systems
Train for regulatory and logistics literacy, hedge procurement, and build cross-border academic ties

Redesigning Education Beyond Procedure in the Age of AI
Redesigning Education Beyond Procedure in the Age of AI

David O’Neill is a Professor of AI/Policy at the Gordon School of Business, SIAI, based in Switzerland. His work explores the intersection of AI, quantitative finance, and policy-oriented educational design, with particular attention to executive-level and institutional learning frameworks.
In addition to his academic role, he oversees the operational and financial administration of SIAI’s education programs in Europe, contributing to governance, compliance, and the integration of AI methodologies into policy and investment-oriented curricula.
Published
Modified
AI excels on known paths, so schools must shift beyond procedure
Assessments should reward framing and defense under uncertainty
This prepares students for judgment in an AI-driven world

Every era has its pivotal moment. Ours came when an AI system scored a gold medal at the world's toughest student math contest. It solved five out of six problems in the International Mathematical Olympiad within four-and-a-half hours, providing clear solutions that official coordinators graded for a total of 35 points. This accomplishment highlights not only the power of computation but also a key shift in our educational systems. When the route to a solution is clear—when methods are established, tactics are defined, and proofs can be systematically searched—machines aren't just helpful; they outperform humans. They work tirelessly within established techniques. If education continues to prioritize mastering these techniques as the highest achievement, we risk judging students on how well they imitate a machine. The correct response is not to reject the machine but to change the focus of the contest. We should teach for the unknown path by encouraging problem finding, framing models, auditing assumptions, transferring knowledge across domains, and crafting arguments under uncertainty. This shift is not only practical, but it is also urgently needed.
The Known Path Is Now a Conveyor Belt
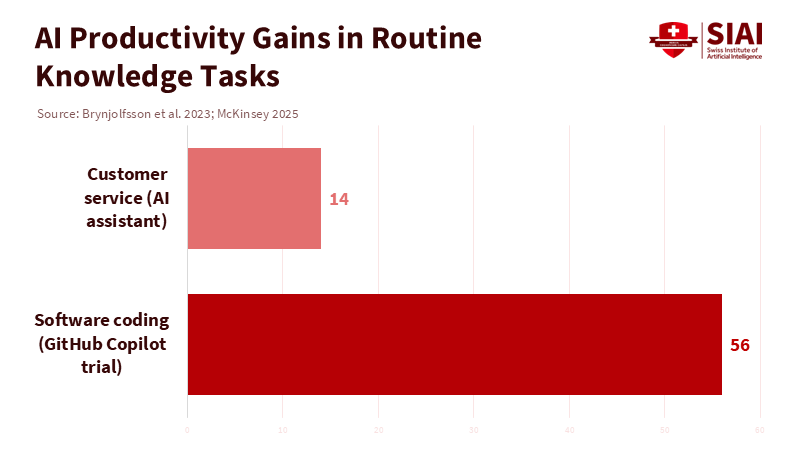
Across various fields, evidence is coming together. When a task's route is clear and documented, AI systems speed up processes and reduce variability. In controlled experiments, developers using an AI pair programmer completed standard coding tasks about 56 percent faster. This result has been replicated in further studies. Customer service agents using a conversational assistant were 14 percent more productive, with greater gains for novices—significant for education systems that want to help lower performers. These findings reflect what happens when patterns are recognizable and "next steps" can be predicted from a rich history of similar tasks. In mathematics, neuro-symbolic systems have reached a significant milestone. AlphaGeometry solved 25 of 30 Olympiad-level geometry problems within standard time limits, nearing the performance of a human gold medalist, and newer systems have formalized proofs more extensively. This is what we should expect when problem areas can be navigated through guided searches of known tactics, supported by larger datasets of worked examples and verified arguments.
The policy issue is straightforward: if education continues to allocate most time and grades to known-path performance—even in prestigious courses—students will understandably look for tools to accelerate their success along these paths. Recent international assessments highlight the consequences of poorly structured digital time. In PISA 2022, students spending up to one hour per day on digital devices for leisure scored 49 points higher in mathematics than those using them for five to seven hours; pushing leisure screen time beyond one hour, and performance declines sharply. The takeaway is not to ban devices but to stop making schoolwork a device-driven search for known steps. The broader labor market context supports this point. Mid-range estimates suggest that by 2030, about a third of current work hours could be automated or accelerated, impacting routine knowledge tasks—exactly the procedural skills that many assessments still prioritize. Education systems that focus on the conveyor belt will inadvertently grade AI usage instead of human understanding.
Method note: To clarify ideas, consider a 15-week algebra course with four hours of homework each week. If 60 percent of graded work is procedural and AI tools cut completion time for those tasks by a conservative 40 percent, students save about 1 hour per week, 15 hours per term. The question is what to do with those hours: focus on more procedures or the skills machines still struggle to automate—defining a problem, managing uncertainty, building a model worth solving, and justifying an answer to an audience that challenges it.
Designing for Unknown Paths
What does it mean to teach for the unknown path while maintaining fluency? The initial step is curricular: treat procedures as basic requirements and dedicate class time to deeper concepts. This means shifting from "Can you find the derivative?" to "Which function class models this situation appropriately for the decision at hand, and what error margin ensures robustness?" From "Solve for x" to "Is x even the right variable to consider?" From "Show that the claim is valid" to "If the claim is false, how would we know as early and cheaply as possible?" The aim is not to confuse students with endless questions for the sake of it, but to structure exercises around selecting, defining, and defending approaches under uncertainty—skills that remain distinctly human, even as computations become quicker.
There are practical ways to achieve this. Give students the answer and ask them to create the question—an exercise that demands attention to assumptions and limitations. Require an "assumption log" and a one-page "model card" with any multi-step solution. This document should outline what was constant, what data were acceptable, what alternatives were explored, and the principal risks of error. Use AI as a baseline: let students develop a solid procedural solution, then evaluate their responses—by challenging, generalizing, or explaining when it might lead them astray. Anchor practice in real inquiries ("What influenced attendance last quarter?") rather than just symbolic manipulation. When students need to make approximations, they should justify the approach they selected and show how their conclusions change as the estimation criteria relax. These are not optional extras; they are habits we can teach and assess.
Research shows that well-designed digital tools can enhance learning when they focus on practice and feedback instead of replacing critical thinking. A significant evaluation linked to Khan Academy found positive learning outcomes when teachers dedicated class time to systematic practice on core skills, while quasi-experimental studies reported improvements at scale. Early tests of AI tutors show higher engagement and faster mastery compared to lecture-based controls, particularly among students who start behind—again, a significant equity issue. The key point is not that an AI tutor teaches judgment. Instead, it's that thorough, data-informed practice frees up teacher time and student energy for developing judgment if— and only if—courses are designed to climb that ladder.
What Changes on Monday Morning
The most crucial factor is assessment. Institutions should immediately transform some summative tasks into "open-tool, closed-path" formats. Students may use approved AI systems for procedural tasks, but they will be scored on the decisions made before those steps and the critiques that follow. Provide the machine's answer and assess the student's follow-up: where it strayed, what different model might change the outcome, which signals mattered most, and which assumption, if incorrect, would compromise the result. Require verbal defenses with non-leading questions—five minutes per student in small groups or randomized presentations in larger classes—to ensure that written work reflects accurate understanding, since leisure device time correlates with significant performance drops. Schedule "deep work" sessions where phones are set aside and tools chosen intentionally, not reflexively.
For administrators, the budgeting focus should be on teacher time. If AI speeds up routine feedback and grading, those hours should be reclaimed for engaging, studio-style seminars where students present and defend their modeling choices. Pilot programs could establish a set target—such as two hours of teacher contact time per week shifted from grading procedures to facilitating discussions—and then monitor the results. Early signs in the workplace suggest that these gains are real. Surveys indicate that AI tools are quickly being adopted across functions, and studies show that saved time often gets redirected into new tasks instead of being wasted. However, redeployment is not automatic. Institutions should integrate this into their schedules: smaller discussion groups, rotating "devil's advocate" roles, and embedded writing support focused on evidence and reasoning rather than just grammar.
Policymakers have the most to address regarding incentives. Accountability systems need to stop awarding most points for de-contextualized procedures and instead assess students' abilities to diagnose, design, and defend. One option is to introduce moderated "reasoning audits" in high-stakes exams: a brief, scenario-based segment that provides a complex situation and asks candidates to create a justified plan instead of completing a finished calculation. Another approach is to fund statewide assessment banks of open-context prompts with scoring guidelines that reward managing uncertainty—explicitly identifying good practices such as bounding, triangulating data sources, and articulating a workable model. Procurement can also help: require that any licensed AI system records process data (queries, revisions, model versions) to support clear academic conduct policies rather than rigid bans. Meanwhile, invest in teacher professional learning focused on a few solid routines: defining a problem, conducting structured estimations, drafting a sensitivity analysis, and defending assumptions with a brief presentation. These skills are transferable across subjects; they are essential for mastering the unknown path.
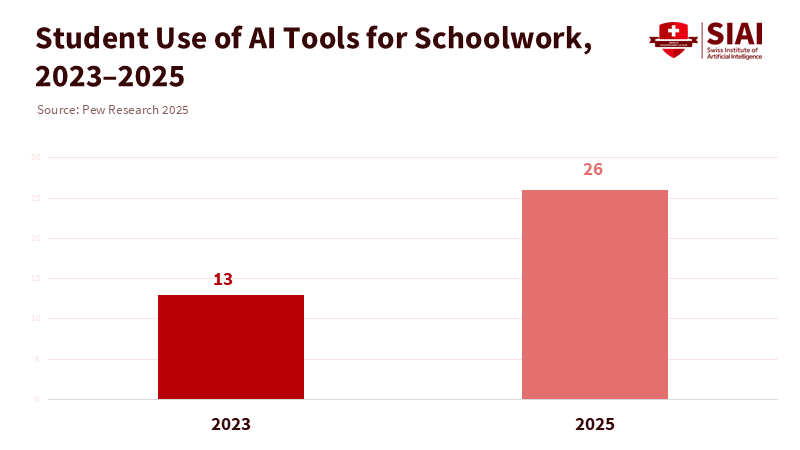
Finally, we should be honest about student behavior. The use of AI for schoolwork among U.S. teens increased from 13 percent to 26 percent between 2023 and 2025, with this trend crossing demographic boundaries. Universities report similar patterns, with most students viewing AI as a study aid for explanation and practice. Ignoring these tools only drives their use underground and misses a chance to teach how to use them wisely. A simple institutional policy can align incentives: allow the use of AI for known steps if documented, and ensure that grades are mainly based on what students do that the model cannot define—tasks, justifying approaches, challenging outputs, and communicating effectively with a questioning audience.
We anticipate familiar critiques. First, won't shifting focus away from procedures weaken fluency? Evidence from tutoring and structured practice suggests otherwise—students improve more when routine practice is disciplined, clear, and linked to feedback, especially if time is shifted toward transfer. Second, won't assessing open-ended tasks be too subjective? Not if rubrics clearly define the criteria for earning points—stating assumptions, bounding quantities, testing sensitivity, and anticipating counterarguments. Third, isn't relying on AI risky because models can make mistakes? That's precisely the goal of teaching the unknown path. We include the model where it belongs and train students to identify and recover from its errors. Fourth, doesn't this favor students who are already privileged? In fact, the opposite can hold. Research shows that the most significant productivity gains from AI assistance tend to benefit less-experienced users. If we create tasks that value framing and explanation, we maximize class time where these students can achieve the most significant growth.
We also need to focus on attention. The PISA digital-use gradient serves as a reminder that time on screens isn't the issue; intent matters. Schools should adopt a policy of openly declaring tool usage. Before any assessments or practice sessions, students should identify which tools they plan to use and for which steps. Afterwards, they should reflect on how the tool helped or misled them. This approach safeguards attention by turning tool selection into a deliberate choice rather than a habit. It also creates valuable metacognitive insights that teachers can guide. Together with planned, phone-free sessions and shorter, more intense tasks, this is how we can make classrooms places for deep thinking, not just searching.
The broader strategic view is not anti-technology; it advocates for judgment. Open-source theorem provers and advanced reasoning models are improving rapidly, resetting the bar for procedural performance. State-of-the-art systems are achieving leading results across competitive coding and multi-modal reasoning tasks. If we keep treating known-path performance as the pinnacle of educational success, we will find that standards are slipping right from under us.
We started with a gold-medal proof counted in points. Now, let's look at a different measure: the minutes spent on judgment each week, for each student. A system that uses most of its time on tasks a machine does better will drain attention, lead to compliance games, and widen the gap between credentials on paper and actual readiness. A system that shifts those minutes to framing and defense will produce a different graduate. This graduate can select the right problem to tackle, gather the tools to address it, and handle an informed cross-examination. The way forward isn't about trying to outsmart the machine; instead, it's about creating pathways where none exist and teaching students to build them. This is our call to action. Rewrite rubrics to emphasize transfer and explanation. Free up teacher time for argument. Require assumption logs and sensitivity analyses. Make tool use clear and intentional. If we do this, the next time a model achieves a perfect score, we will celebrate and then pose the human questions that only our students can answer.
The views expressed in this article are those of the author(s) and do not necessarily reflect the official position of the Swiss Institute of Artificial Intelligence (SIAI) or its affiliates.
References
Brynjolfsson, E., Li, D., & Raymond, L. (2023). Generative AI at work (NBER Working Paper No. 31161). National Bureau of Economic Research.
Castelvecchi, D. (2025). DeepMind and OpenAI models solve maths problems at level of top students. Nature News.
DeepMind. (2025, July 21). Advanced version of Gemini with Deep Think officially achieves gold-medal standard at the International Mathematical Olympiad.
Education Next. (2024, December 3). AI tutors: Hype or hope for education?
Khan Academy. (2024, May 29). University of Toronto randomized controlled trial demonstrates a positive effect of Khan Academy on student learning.
McKinsey Global Institute. (2023, June 14). The economic potential of generative AI: The next productivity frontier.
McKinsey. (2025, January 28). Superagency in the workplace: Empowering people to unlock AI's full potential at work.
OECD. (2023, December). PISA 2022: Insights and interpretations.
OECD. (2024, May). Students, digital devices and success: Results from PISA 2022.
OpenAI. (2025, April 16). Introducing o3 and o4-mini.
Peng, S., Kalliamvakou, E., Cihon, P., & Demirer, M. (2023). The impact of GitHub Copilot on developer productivity (arXiv:2302.06590).
Pew Research Center. (2025, January 15). About a quarter of U.S. teens have used ChatGPT for schoolwork, double the share in 2023.
Trinh, T. H. et al. (2024). Solving Olympiad geometry without human demonstrations. Nature, 627, 768–774.
The Guardian. (2025, September 14). How to use ChatGPT at university without cheating: "Now it's more like a study partner."
David O’Neill is a Professor of AI/Policy at the Gordon School of Business, SIAI, based in Switzerland. His work explores the intersection of AI, quantitative finance, and policy-oriented educational design, with particular attention to executive-level and institutional learning frameworks.
In addition to his academic role, he oversees the operational and financial administration of SIAI’s education programs in Europe, contributing to governance, compliance, and the integration of AI methodologies into policy and investment-oriented curricula.
From Imperial Leagues to Learning Levers: How China's Alliance Logic Will Reshape Global Education
China’s R&D surge and alliance politics are reshaping global education
Export controls and demographics redirect students and research
Universities must hedge, manage openness, and diversify

Her
Teach the Noise: Why Finance Schools Must End the Black-Box Habit
Neural networks rarely beat simple baselines in noisy markets
Finance needs transparent models that fail visibly
Glass-box practices must be the default

In 2025, a new Nature study on stock-market prediction reached a surprising concl
Not a Cliff, a Slope: Teaching Through a US-China Power Transition
China’s rise is gradual, not sudden
Power shifts depend on capabilities, satisfaction, and institutions
Education must adapt with diversification and resilience

Across the global economy, one pa
Build the Neutral Spine of AI: Why Europe Must Stand Up Its Own Stack
Build the Neutral Spine of AI: Why Europe Must Stand Up Its Own Stack

Catherine McGuire is a Professor of Computer Science and AI Systems at the Gordon School of Business, part of the Swiss Institute of Artificial Intelligence (SIAI). She specializes in machine learning infrastructure and applied data engineering, with a focus on bridging research and large-scale deployment of AI tools in financial and policy contexts. Based in the United States (with summer/winter in Berlin and Zurich), she co-leads SIAI’s technical operations, overseeing the institute’s IT architecture and supporting its research-to-production pipeline for AI-driven finance.
Published
Modified
Europe’s schools rely on foreign AI infrastructure, creating vulnerability
A neutral European stack with local compute and governance can secure continuity
This ensures resilient, interoperable education under global tensions

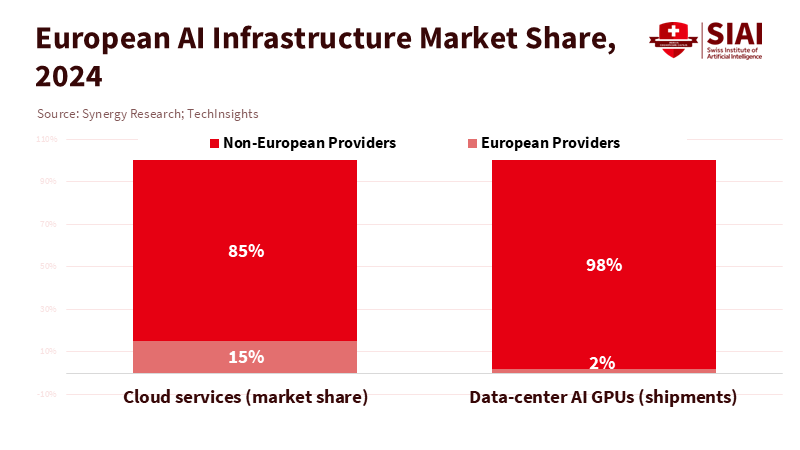
The most critical number in European AI right now is fifteen. That is the share of the continent's cloud market held by European providers in 2024; the remaining eighty-five percent is controlled by three U.S. companies. Pair that dependency with another figure: NVIDIA shipped roughly ninety-eight percent of all data-center AI GPUs in 2023. This reveals an uncomfortable truth: Europe's schools, universities, and public labs depend on foreign hardware and platforms that affect every lesson plan, grant proposal, and research workflow we care about. As U.S.–China technology tensions grow and export controls expand, this isn't just a pricing issue; it's a problem of reliability, access, and values for education systems that cannot pause when the rules change. Europe has the necessary pieces to change this situation—laws, computing infrastructure, research, and governance. Still, it must assemble them into a coherent, education-friendly "third stack" that can withstand geopolitical shifts and is designed to work together.
From Consumer to Producer: Why Sovereignty Now Means Interoperability
The case for a European stack isn't about isolation. It is a response to two converging trends: stricter export controls around advanced chips and new AI regulations in Europe with hard, upcoming deadlines. The United States tightened access to advanced accelerators and supercomputing items with rules in October 2022 and October 2023. Clarifications in 2024 and updates in 2025 expand the rules and introduce restrictions on AI model weights. Meanwhile, the EU's AI Act will come into effect on August 1, 2024, with restrictions and AI education duties starting in February 2025, general-purpose model obligations from August 2025 (with systemic-risk thresholds at 10^25 FLOPs), and high-risk system rules essentially landing by August 2026. To be clear, restrictions at the hardware level and requirements at the application level are arriving simultaneously, and education must not get caught in between. A European stack ensures that classrooms and labs have lawful, reliable access to compute and models, even as geopolitical circumstances change.
There's also a compatibility risk that rarely shows up in procurement documents. If two AI superpowers develop competing, non-compatible ecosystems—different chips, interconnects, tools, and model documentation norms—then educational content, evaluation pipelines, and safety tools won't move smoothly across borders. Analysts now view AI as a matter of national security, with incentives for separation being high, especially as "block economies" reappear. Education is downstream of this competition, relying on standard file formats, portable model cards, and shared inference runtimes. The more innovative approach is not to pick a side but to build a neutral spine that can translate between them and keep European teaching and research ongoing under pressure.
Crucially, Europe is not starting from scratch. The EuroHPC program has created world-class systems, led by JUPITER—Europe's first exascale supercomputer—launched in September 2025 in Jülich, and Switzerland's "Alps" system at CSCS, launched in 2024. These platforms aren't just valuable for their processing power; they allow governments and universities to test procurement, scheduling, and governance on a continental scale. They demonstrate that Europe can establish computing resources on its soil, under European law, while still using top-tier components.
A neutral European stack must, therefore, focus on four practical ideas. First, portability: standardize open exchange formats and evaluation artifacts so models trained or refined on European hardware can run on multiple platforms without months of additional work. Second, governed access: compute should be allocated through institutions and grant programs already in use by the education sector, with visible queue service-level agreements and commitments so coursework runs when needed. Third, energy awareness: data-center power demand in Europe is set to rise significantly this decade, with several forecasts suggesting a doubling or near-tripling by 2030; education workloads should prioritize efficient open-weight models, shared fine-tunes, and "green windows" that align with renewable energy surpluses. Finally, transparent data governance: a Gaia-X style labeling system can show whether a tool keeps student data in-region, supports audits by data protection officers, and manages copyrighted material appropriately. These are not ideological choices; they are protective measures against disruption.
What Schools, Ministries, and Regulators Should Do Next
Start with the procurement process. Treat model providers and cloud capacity like essential services, not optional apps. This means securing major contracts with at least one European provider for each layer: EU-based cloud for storage and inference, EuroHPC resources for training and research, and a mix of European model vendors—both open and proprietary—so curricula and research aren't reliant solely on foreign licenses. This is achievable: European model companies have scale and momentum. In September 2025, Mistral raised €1.7 billion in a Series C led by ASML, leading to a valuation of about €11.7 billion. Germany's Aleph Alpha closed a Series B exceeding $500 million in late 2023. A resilient education stack should provide ways to use and examine such models in line with European law and practice.
Next, set clear, immediate goals that convert strategy into reality in the classroom. Over the next twelve months, every teacher-education program and university department with a digital curriculum should have access to and training on an approved set of models and data services hosted in Europe, specifically for educational use. The focus should not be on familiarity with slideshows; it should be about instructor assignments that run on the designated services at predictable costs. Where reliable data is lacking, we can create transparent estimates: if a national system wishes to offer 100,000 students a modest set of 300 classroom inference tasks over a semester at about 10^11 FLOPs per task for efficient models, the total would be around 3×10^16 FLOPs—comfortably supported by a mix of local inference on open weights and scheduled inquiry on shared clusters. The point of detailing such calculations is to highlight that most educational use doesn't require extreme-scale training runs that trigger "systemic risk" thresholds in EU law; it requires reliable, documented, mid-sized capacity.
Next, invest in the translation layers. The fastest way to lose a year is to find that your curriculum relies on a model or SDK that your provider cannot legally support. National ed-tech teams should maintain a "portability panel" comprising engineers and teachers tasked with ensuring that lesson-critical models and datasets are convertible across platforms and clouds, with model cards and evaluation tools stored under European oversight. This concern is not abstract; when one vendor dominates the accelerator market and the leading clouds run proprietary systems, a licensing change can disrupt classrooms overnight. The more Europe insists on portable inference and well-documented build processes, the more resilient its teaching and research will be.
Regulators can help close the loop. The AI Act's phased rules are not a burden to navigate; they outline a product roadmap for an education-friendly stack. The requirements for general-purpose models—technical documentation, cybersecurity, testing for adversarial issues, serious-incident reporting, and summaries of training data—reflect what schools and universities should demand anyway. Oversight bodies can expedite alignment by offering sector-specific guidance and by funding "living compliance" sandboxes, where universities can test documentation, watermarking, and red-teaming practices using EuroHPC resources. The Commission's decision not to pause the Act—and its guidance schedule for models with systemic risk—offers helpful certainty for planning syllabi and budgets for two academic years.
The Neutral Spine We Build Now
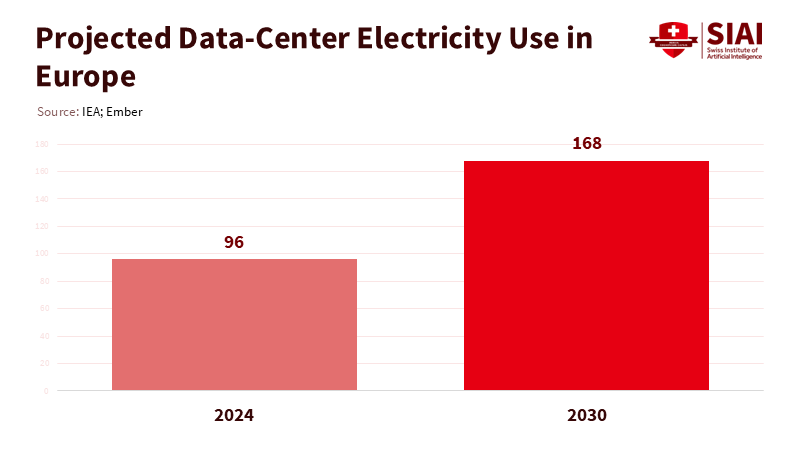
Energy management and site selection will determine whether an education-friendly stack becomes a public benefit or remains just a concept. Global data-center electricity demand is expected to more than double by 2030, with the IEA's baseline scenario estimating about 945 TWh—around the current energy usage of Japan—with a significant portion of the growth occurring in the U.S., China, and Europe. Within Europe, studies project demand could rise from about 96 TWh in 2024 to about 168 TWh by 2030. Several analyses predict a near-tripling in specific Northern markets, leading to over 150 TWh of consumption across the continent by the end of the decade. An education-first policy response is clear: prioritize efficient, European-hosted models for daily classroom use, create "green windows" for training and extensive inference that match renewable energy surpluses, and require providers to disclose energy estimates for each task alongside their costs so departments can plan effectively.
Location and legal frameworks are just as crucial as power consumption. Switzerland serves as a practical center for cross-border research and educational services. It is central to Europe's knowledge networks, has updated its Federal Act on Data Protection to match GDPR standards, and benefits from an EU adequacy decision. This simplifies managing cross-border data flows. Adding a Gaia-X-style trust label that indicates where student data is stored, how audits are conducted, and how copyrighted materials are handled in training, provides an operational model that districts and deans can adopt without needing to hire legal experts in AI. This is what a neutral spine looks like when built thoughtfully: legally sound, energy-conscious, and designed for portability.
Anticipating the pushback clarifies the policy choice. Some will see a third stack as redundant given the scale of global platforms. This view underestimates risk concentration. When three foreign firms control most of the local cloud market and one U.S. vendor supplies nearly all AI accelerators, any geopolitical or licensing shock can quickly affect schools. Others may worry about costs. Yet the cost of losing continuity—canceled lab sessions, frozen grants, untestable curricula—rarely appears in bid comparisons. The way forward is not to eliminate foreign tools; it is to ensure European classrooms can maintain their teaching and European labs can continue their research when changes occur elsewhere. Existing examples—JUPITER, Alps, and a growing number of European model companies—show that the essential elements are in place. The work now involves integration, governance, and teaching the next million students how to use them effectively.
In the end, the number fifteen serves as both a warning and an opportunity. The warning is about dependency: an education system that relies on others for most of its computing and cloud resources will one day realize that someone else has made its choices. The opportunity is to build: an interoperable, education-friendly European stack—legally grounded, geopolitically neutral, and energy-aware—that utilizes JUPITER-class capability and Swiss-based governance to keep classes running, labs effective, and research open. The implementation timeline is clear; the AI Act's deadlines are public and imminent, and energy limitations are tightening. The choice is equally straightforward: move forward now with procurement, compute scheduling, and model portfolios while prices and regulations are stable, or wait for the next round of export controls and accept that curriculum and research will change on someone else's timetable. The students in our classrooms deserve the first option, as do the teachers who cannot afford another year of uncertainty.
The views expressed in this article are those of the author(s) and do not necessarily reflect the official position of the Swiss Institute of Artificial Intelligence (SIAI) or its affiliates.
References
Aleph Alpha. (2023, November 6). Aleph Alpha raises a total investment of more than half a billion U.S. dollars (Series B announcement).
ASML. (2025, September 9). ASML and Mistral AI enter strategic partnership; ASML to invest €1.3 billion in Mistral's Series C.
Bureau of Industry and Security (U.S. Department of Commerce). (2024, April 4). Implementation of Additional Export Controls: Certain Advanced Computing Items; Supercomputer and Semiconductor End Use (corrections and clarifications).
Bureau of Industry and Security (U.S. Department of Commerce). (2025, January 13). Framework for Artificial Intelligence Diffusion (Public Inspection PDF summarizing December 2024 expansions including HBM and AI-related controls).
CSCS – Swiss National Supercomputing Centre. (2024, September 16). New research infrastructure: "Alps" supercomputer inaugurated.
DataCenterDynamics (via TechInsights). (2024, June 12). NVIDIA data-center GPU shipments totaled 3.76 million in 2023 (≈98% market share).
EDÖB/FDPIC (Swiss Federal Data Protection and Information Commissioner). (2024, January 15). EU adequacy decision regarding Switzerland.
EuroHPC Joint Undertaking. (2025, September 5). JUPITER: Launching Europe's exascale era.
European Commission. (2025, August 1). EU rules on GPAI models start to apply: transparency, safety, accountability (AI Act GPAI obligations and systemic-risk threshold).
Gaia-X European Association. (2024, September). Compliance Document: Policy rules, labelling criteria, and trust framework.
IEA. (2025, April 10). Energy and AI: Data-centre electricity demand to 2030 (news release and analysis).
McKinsey & Company. (2024, October 24). The role of power in unlocking the European AI revolution.
Mistral AI. (2025, September 9). Mistral AI raises €1.7 billion (Series C) to accelerate technological progress.
RAND Corporation. (2025, August 4). Chase, M. S., & Marcellino, W. Incentives for U.S.–China conflict, competition, and cooperation across AGI's five hard national-security problems.
Reuters. (2025, July 4). EU sticks with timeline for AI rules despite calls for delay.
Synergy Research Group. (2025, July 24). European cloud providers' local market share holds steady at ~15% (2024 market ~€61 billion).
Tomorrow's Affairs. (2024, October 26). The legacy of the Cold War: Economics stuck between two worlds.
Ember. (2025, June 19). Grids for data centres in Europe (EU demand projection: 96 TWh in 2024 → 168 TWh by 2030).
Catherine McGuire is a Professor of Computer Science and AI Systems at the Gordon School of Business, part of the Swiss Institute of Artificial Intelligence (SIAI). She specializes in machine learning infrastructure and applied data engineering, with a focus on bridging research and large-scale deployment of AI tools in financial and policy contexts. Based in the United States (with summer/winter in Berlin and Zurich), she co-leads SIAI’s technical operations, overseeing the institute’s IT architecture and supporting its research-to-production pipeline for AI-driven finance.