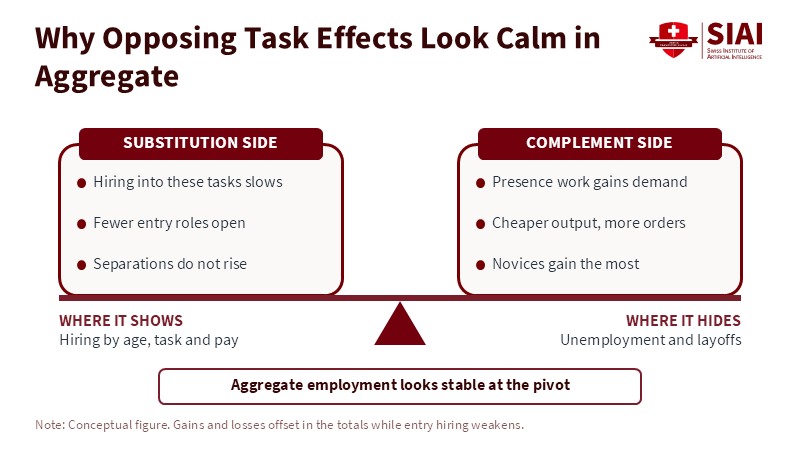
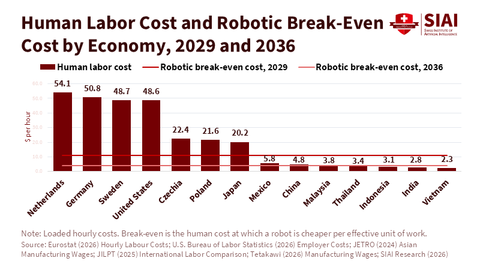
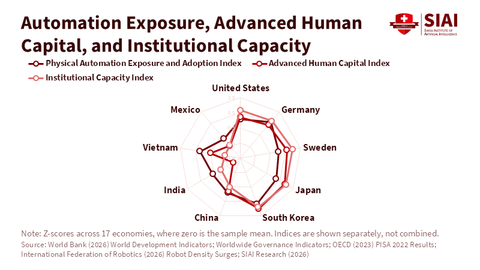
Why Opposing Task Effects Look Calm in Aggregate Picture Member for 2 years 1 month Real name SIAI Chart Bio SIAI Chart Input Oct 7, 2026 20:46 Modified Oct 7, 2026 20:55 Figure 2: Losses and gains balance in the totals, so the change shows up in who gets hired, not in the unemployment rate. Related article: Artificial Intelligence and the Job Market: Jobs Created and Lost at Once Picture Member for 2 years 1 month Real name SIAI Chart Bio SIAI Chart Previous Automation Adoption by 2035 across US Occupational Groups Next Three Task Types inside One Job Similar Post Nov 18, 2026 00:18 Share of Body Mass and Resting Energy Use by Organ ina 70 kg Adult Nov 18, 2026 00:18 Effect of High Cognitive Load on Task Success and Choice Consistency Nov 17, 2026 15:54 Observable Characteristics and Hidden Drivers of Al Returns Nov 17, 2026 15:54 The Marginal Rule for Al Investment Nov 5, 2026 07:34 Labor Requirements by Productivity Gain and Demand Elasticity Nov 5, 2026 07:34 Public Debt Relative to the No-Al Path by Scenario and Economy, 2036 Nov 5, 2026 07:34 Tax Revenue Relative to the No-Al Path by Scenario and Economy, 2036 Nov 5, 2026 07:34 Human Labor Cost and Robotic Break-Eve Cost by Economy, 2029 and 2036 Nov 5, 2026 07:34 Automation Exposure, Advanced Human Capital, and Institutional Capacity wf Dhucical Antamation Evynnacure and Institutional Capacity