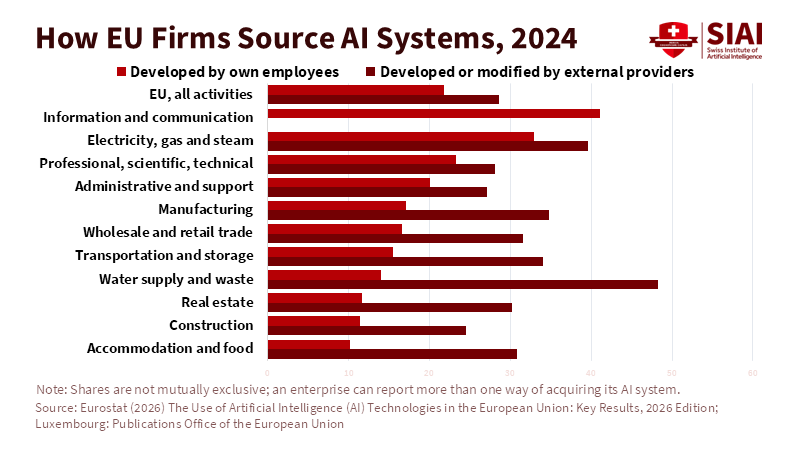
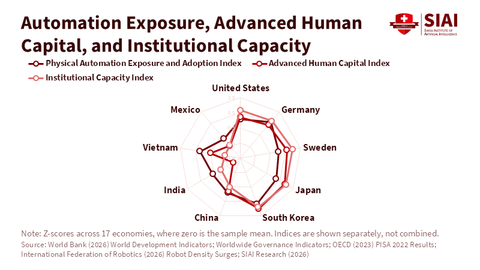
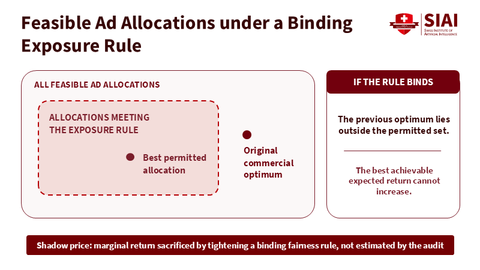
How EU Firms Source AI Systems, 2024 Picture Member for 2 years Real name SIAI Chart Bio SIAI Chart Input Sep 26, 2026 03:40 Modified Sep 26, 2026 03:47 Figure 1. Ready-made software dominates everywhere; in-house development stays concentrated in a few sectors. Related article: [AI and Workforce] How Firms Build AI Workforce Capability Picture Member for 2 years Real name SIAI Chart Bio SIAI Chart Previous Employment Share by GenAI Exposure, Sex and Income Next Workforce Changes among US Firms Using AI, 2023-2024 Similar Post Nov 5, 2026 07:34 Robot Installations and Physical Al Diffusion Paths, 2020-2036 Nov 5, 2026 07:34 Tax Revenue Relative to the No-Al Path by Scenario and Economy, 2036 Nov 5, 2026 07:34 Foundational Skills, Researcher Density, and Research Intensity by Economy Nov 5, 2026 07:34 Human Labor Cost and Robotic Break-Eve Cost by Economy, 2029 and 2036 Nov 5, 2026 07:34 Labor Requirements by Productivity Gain and Demand Elasticity Nov 5, 2026 07:34 Public Debt Relative to the No-Al Path by Scenario and Economy, 2036 Nov 5, 2026 07:34 Outcomes of Displaced Workers by Scenario and Economy, 2036 Nov 5, 2026 07:34 Automation Exposure, Advanced Human Capital, and Institutional Capacity wf Dhucical Antamation Evynnacure and Institutional Capacity Nov 4, 2026 02:00 Feasible Ad Allocations under a Binding Exposure Rule