Analysis of Salesman Performance Based on Relational Effects
Published
Hyeoku Jin*
* Swiss Institute of Artificial Intelligence, Chaltenbodenstrasse 26, 8834 Schindellegi, Schwyz, Switzerland
This study investigates the performance of direct-selling salesman branches, pointing out the limitations of existing analyses that focus predominantly on quantitative factors (e.g., headcount, market size), and aims to empirically identify the influence of a qualitative factor—namely, "relationships" (i.e., informal interactions among members within the branches)—on performance. The core assertion is that the performance of salesmen is not a set of mutually independent events, but rather a dependent relationship where they influence each other through relational networks such as information exchange and cooperation with colleagues.
To analyze this, we first confirmed the existence of a nonlinear effect of branch headcount on performance through regression analysis. Furthermore, we utilized the Symmetric Connection Model (Jackson & Wolinsky,1996) to estimate the structure of the organizational 'relationships' that cause this nonlinearity. Based on the benefits and costs associated with relationship formation, this model estimates whether each branch adopts a Complete, Star, or Empty network structure. To estimate the variables required for the model, we assumed that information regarding benefits and costs is contained within the residuals of the regression analysis and then calculated the relational benefits and costs for each branches.
The analysis results showed that approximately 52% of the total branches formed a 'Complete' structure with dense mutual connections, while 40% formed a 'Star' structure mediated by a central figure acting as a hub. Conversely, about 8% of the branches were estimated to have an 'Empty' structure with minimal interaction among members. This suggests that the synergistic effects of the branch may be difficult to achieve when the costs of relationship formation are high (e.g., due to low meeting attendance), even if the headcount is large.
This study is significant in that it quantitatively measured the branch’s previously unseen 'synergistic effect' and provided an analytical framework. The findings can contribute to companies establishing effective operational strategies that consider qualitative aspects, such as personnel reallocation and incentive design, to maximize organizational performance.
Keywords:
Sales performance; network structure; connection model; organizational cohesion;
1. Introduction
Traditional Korean companies have grown through a sales system called door-to-door sales (or direct sales). In this system, a salesman sells the company's products to potential customers in various locations rather than a designated place of business. Generally, this predominantly involves sales pitches to people with whom the salesman has a pre-existing relationship, such as family or friends. Upon completing a sale, the salesman is paid a fixed commission from the company corresponding to the sold item. Consequently, the structure dictates that no compensation is received if no sales are made.
Meanwhile, the salesman is mandatorily affiliated with the company's smallest organizational unit (hereinafter referred to as a 'branch'). A branch consists of the group leader and a group of other salesmen. They become colleagues who engage in active interaction, such as gathering at the office every morning for meetings or attending workshops together. Naturally, they exchange information regarding their sales activities. They also attempt to secure additional potential customers by recruiting new individuals to join the branch as salesmen.
For companies operating such a door-to-door sales system, the primary concern would be how to maximize sales performance. The easiest approach is to observe the differences between high-performing and low-performing branches within the company. For example, one might compare various aspects such as the number of salesmen in the two branches, their primary operating regions, or the presence of star performers. In conducting such business analyses, experience suggests that practitioners in the field tend to focus mostly on quantitative factors (headcount, market size). While quantitative factors cannot be ignored, qualitative factors must also be considered when analyzing interactive, organic entities. This is because performance cannot simply be reproduced even if the quantitative factors are identical.
1.1. Problem Statement
Therefore, considering only quantitative factors in organizational research is insufficient for conducting proper analysis. This is because the performance of the salesmen who constitute the organization can hardly be viewed as a set of mutually independent events. Even when conducting regression analysis, if there are dependent variables, reliable analysis is possible only after additional preprocessing. Similarly, if the performance of the salesmen composing the organization is currently dependent, explaining it solely through simple quantitative variables is prone to misunderstanding.
To assert that salesmen's performances are mutually independent events requires a major assumption that there is absolutely no interaction between the salesmen. However, considering the activities occurring within the door-to-door sales system described earlier, this is likely a rare or exceptional circumstance. In the real world, most organizations (consisting of two or more people with the same goals/interests) involve mutual interaction. Therefore, the main direction of this study is to uncover the informal interaction structure nested within the institutional/formal structure of being assigned to a branch from the start.
1.2 Purpose
The purpose of this paper is, therefore, to provide an idea of how to capture and utilize the informal interactions of salesmen for analysis. In other words, this study will be a process of empirically demonstrating the organization's 'synergistic effect' that has previously been only a conceptual idea, thereby providing valuable business insights.
2. Theoretical Framework
The performance of an organization is determined not only by individual abilities but also by how members are connected and interact with each other. In particular, when the connections among members are strong and information exchange occurs smoothly, the organization can achieve high performance through synergy. On the other hand, when connections are weak or fragmented, communication costs increase, and efficiency decreases.
In practice, quantitative factors such as the number of members, average sales per person, and regional variables have mainly been used to explain performance. However, these factors are insufficient to explain the differences in outcomes that occur even among branches with similar numbers of people. In reality, even when the number of people is the same, performance differences arise depending on the structure of relationships..
To theoretically explain these relational effects, this study adopts the Symmetric Connection Model. This model explains the relationships between individuals within an organization as a network of connections, in which each member decides whether to maintain relationships with others based on the trade-off between benefits from connection and costs of maintaining the relationship. According to this model, the overall utility of the organization is determined by the sum of the benefits gained through connections among members, minus the costs associated with maintaining these relationships. Formally, if the benefit obtained from connecting with another member is denoted as $\delta$, and the cost of maintaining that connection as $c$, the utility of member $i$ is expressed as follows:
$$u_{i} (g) = \sum_{j \neq i} \delta^{d(i,j)} - \sum_{j: i,j \in g } c_{ij}, \text{ where } 0 \leq \delta \leq 1 ; 0 \leq c$$
where $d(i,j)$ represents the shortest path between members $i$ and $j$. In this model, as the number of members increases, the total potential connections increase exponentially, but so do the costs of maintaining them.
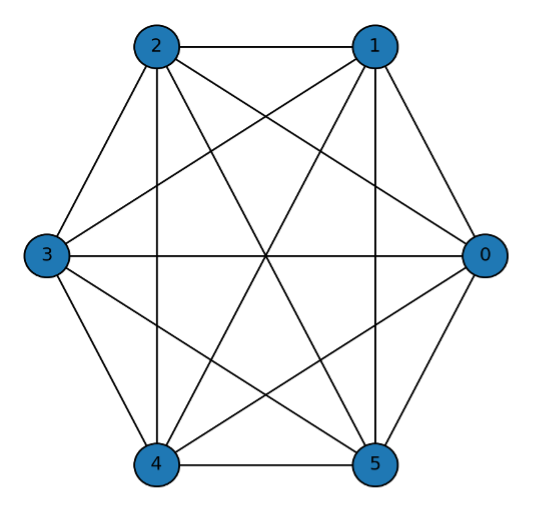
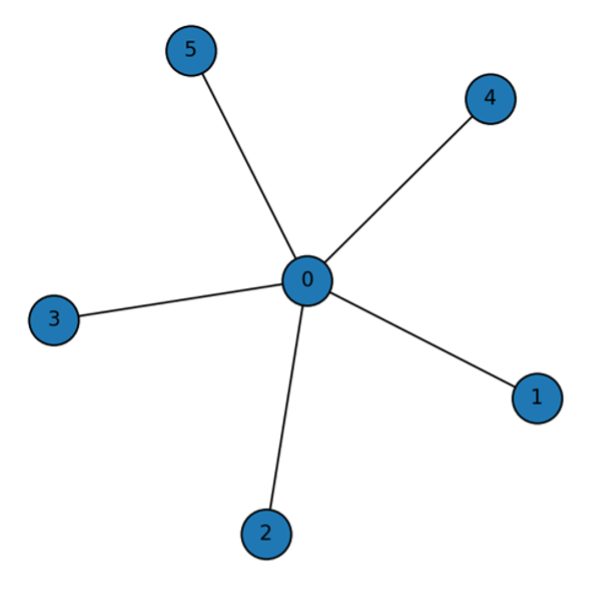
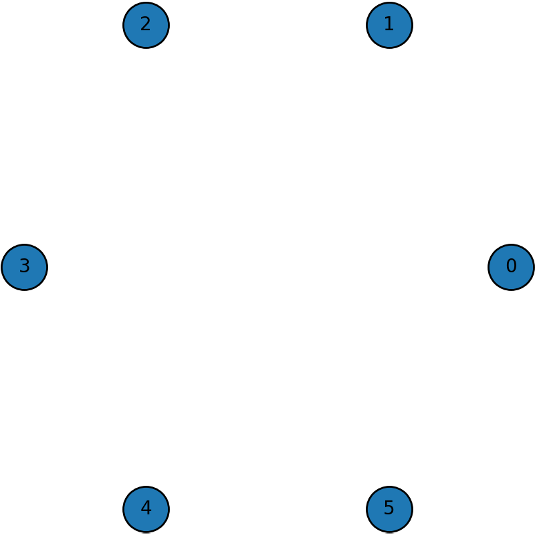
Based on this model, three representative types of network structures can be derived: Complete Network, Star Network, and Empty Network. A Complete Network is a state where all members are interconnected, showing the highest level of cohesion. A Star Network is one where a few central members are connected to many others, while peripheral members are not directly connected. An Empty Network represents a situation where there are almost no connections among members. For a detailed derivation of the criteria and the formal conditions defining the Complete, Star, and Empty network types, please refer to Appendix A.
3. Methodology and Research Model
This study aims to empirically identify the relational effects that exist within sales branches. To achieve this, actual sales data from a domestic direct sales company were analyzed, and quantitative analysis was conducted to verify the impact of relational structures on sales performance.
3.1. Data and Variables
The data used in this study consist of branch-level information from a nationwide sales organization. The main variables include branch-level sales, number of salesman (headcount), attendance frequency, and regional information.
- Sales (dependent variable): The total sales generated by each branch.
- Headcount (independent variable): The number of salesman belonging to each branch.
- Meeting Frequency: The average monthly frequency of meeting attendance by branch members.
- Region: Dummy variable controlling for regional differences.
In order to ensure comparability among variables, logarithmic transformation was applied to both sales and headcount. This also allows for interpreting the estimated coefficients as elasticities.
3.2. Empirical Model Specification
The empirical model used in this study consists of two stages. First, the non-linear relationship between the number of members and sales performance is estimated through regression analysis. Second, based on the residuals from this model, network structures are inferred to identify relational effects that cannot be explained by size alone.
The basic regression model is as follows:
$$log (\text{Sales}_i) = \alpha + \beta_1 log (\text{Head count}_i) + \epsilon_i$$ - Equation (2)
To capture potential non-linear effects, a quadratic term is added:
$$log (\text{Sales}_i) = \alpha + \beta_1 log (\text{Head count}_i) + \beta_2 [ log (\text{Head count}_i)]^2 + \epsilon_i$$ - Equation (3)
If the coefficient $\beta_2$ is statistically significant, it implies the existence of a non-linear relationship between branch performance and headcount, in addition to a simple linear relationship.
3.3. Estimation of Relational Effects
After estimating the above model, the residuals ($\epsilon_i$) are analyzed to capture performance differences not explained by quantitative size alone. These residuals are regarded as the outcome of relational effects within each branch, which are defined by the trade-off between the benefits gained from connection and the costs of maintaining those relationships.
To formalize this relational aspect, the Symmetric Connection Model is applied. Each branch is modeled as a network consisting of N members, and its performance is determined by the combination of connection benefits and maintenance costs. Based on the estimated coefficients, branches are categorized into three network types — Complete, Star, and Empty networks — as proposed in the theoretical framework.
- Complete Network: $c< \delta - \delta^2$
Salesmen within the same branch are closely interconnected with one another.
- Star Network: $\delta - \delta^2 < c < \delta + \frac{N-2}{2} \delta^2$
A branch structure where relationships are centered around one key salesman.
- Empty Network: $\delta + \frac{N-2}{2} \delta^2$
A structure where members belong to the same branch but engage in sales activities individually, without forming relationships with each other.
3.4. Cohesion Index (CI)
The regression analysis model and the Connection Model allowed us to identify the efficient network structure for each branch. However, it would be a much simpler and easier method if we could estimate the status of a branch through a simple indicator rather than performing this process repeatedly. The crucial difference between the Empty network and the Star/Complete networks can be distinguished by the presence or absence of relationships. Therefore, if we can determine the strength of relationships for each branch, we can classify whether that branch has existing relationships or whether its relationships are weak or nonexistent. We aim to reveal this through a metric called the Cohesion Index.
Cohesion Index (CI) is defined as follows:
$${CI}_{i} =\frac{\text{Observed Attendance}_{i}}{\text{Expected Attendance}_{\text{by group size}}} $$
If a branch shows a high CI value, it can be inferred that it has strong relationships and thus corresponds to either a Star or Complete Network. Conversely, a low CI value indicates that the branch is likely to have an Empty structure.
4. Results
4.1. Regression Analysis Results
The results of the regression analysis are presented in Table 1. In Model (2), the linear relationship between the number of members and sales performance was estimated, and in Model (3), a quadratic term was added to identify non-linear effects. (Standard errors are displayed in partentheses.)
| Model | Results | $R^2$ |
| (2) | $log() = .72 + 1.25 log()$ | .75 |
| (3) | $log() = .52 + 2.07 log() - 0.61 [log ]^2$ | .78 |
As shown in Model (3), the coefficient of the quadratic term is significant, confirming the existence of a non-linear relationship between headcount and sales performance. The negative sign implies that while increasing the number of members initially improves performance, after a certain threshold, relational and coordination costs begin to increase, reducing overall efficiency. Therefore the number of people does not guarantee higher performance.
This situation is self-evident when considering the real-world context. The Data Generation Process for the number of salesmen in an branch increases as an active salesman recruits their acquaintances or family members to join the branch they belong to. In such cases, the bond between them is established, and the new members become incorporated into the existing relational network of the branch and begin to interact. Ultimately, it is this relationship that induces nonlinearity. The maximum possible number of relationships among individuals in an organization can be expressed as $N^2/2$. This is why the quadratic term was added earlier—it was a method to capture these 'relationships'.
4.2. Symmetric Connection Model Results
Through the preceding results, we have confirmed the existence of a nonlinear effect of the number of salesmen on organizational performance. The question then becomes: how can we capture the structure of these internal organizational relationships that gives rise to this effect? Before addressing this, let's briefly examine how relationships can be linked to performance. Salesmen typically sell to people they already know. Therefore, regardless of how large one's personal network is, there is a clear limitation to long-term revenue generation. While there are various ways to expand relationships, one method is to utilize relationships of relationships. That is, expansion occurs not only through directly connected relationships but also through connections linked to those relationships. Similarly, bringing in new salesmen allows for the expansion of relationships, which secures information—potential customers—that can lead to increased performance. This type of information necessarily moves through interactions between connected salesmen; that is, through relationships.
One way to understand how salesmen within an organization are connected is to observe the extent of their mutual exchange. This might involve tracking who calls whom, how often they talk per week, the topics of their conversations, or whether they participate in company meetings or workshops together. However, collecting such data is challenging, and some parts may involve sensitive personal information, making them unsuitable for analysis.
Therefore we aim to identify the relational configuration of each salesman organization using the Symmetric Connection Model. To apply this model, two variables must be estimated: the benefit and the cost components. To do this, we include the existing headcount term along with regional dummy variables to control for the varying market size effects across different regions
$$\text{Sales}_i = \alpha_i + \beta_1 \text{Headcount}_i + \beta \text{Region}_i + \epsilon_i$$ - Equation (5)
The fundamental assumption in estimating these variables is that the residual term, $\epsilon_i$, left after controlling for headcount and operating region in the preceding regression Equation (5), captures the unexplained performance variation. This variation is assumed to contain the necessary information to derive the two parameters we seek: the connection benefit $\delta$ and the relationship maintenance cost $c$.
Therefore, from these variables, we can estimate the benefit and cost of forming relationships among salesmen for each branch. Examining the cost component first, it arises from establishing relationships. Spending time—such as regularly meeting for meals or talking on the phone—all contributes to the cost of maintaining that relationship. If so, let's consider the unique cost incurred by a salesman to maintain relationships with other salesmen. This involves the morning meeting, which was introduced earlier. Attending this meeting provides an excellent opportunity to form relationships with other salesmen without spending extra time or money. Hence, if a branch's meeting frequency is high, it can be rephrased that the aforementioned cost is 'low'.
$$\text{Sales}_i = \alpha_i + \beta_1 \text{Headcount}_i + \beta \text{Region}_i + \beta_2 \text{Non Attendance}_i + \epsilon_i$$ - Equation (6)
Since morning meetings are held 20 days per month uniformly across all branches, the average meeting attendance frequency for each branch can be estimated without bias based on this. To represent the cost component, we introduce a variable for 'the number of days meetings were not attended'. After controlling for this variable that allows us to estimate the cost, the residual term should contain only the information regarding the benefit salesmen gain through relationships. Here, we assume that the distribution of the residual term does not follow a specific probability distribution, but we exclude a Uniform distribution. The reason for excluding a Uniform distribution is that it is highly unlikely to occur in the real world (as it would imply that all salesmen have identical degrees).
$$ c_i = \epsilon_i = \tau_i$$ - Equation (7)
$$\delta_i = \tau_i$ - Equation (8)
Finally, the cost component can be estimated from the differences between the respective residual terms. Lastly, in order to comply with the data range required by the Connection Model for application, we perform min-max scaling on the calculated benefit and cost values.
After undergoing the calculation process described above, the most efficient network type for each branch is determined based on the relationship between the calculated benefit and cost. Representative real-world cases for each type can be observed in Table 2.
| Network Type | Group Information | Graph |
| Complete | Headcount: 10 Region: South Gyeonggi Attendance: 16/20 Sales: 120 $c = 0.03$, $\delta = 0.42$, $\delta^2 = 0.18$ $\delta + \delta^2 > c$ | |
| Empty | Headcount: 6 Region: South Gyeonggi Attendance: 8/20 Sales: 38 $c = 0.47$, $\delta = 0.27$, $\delta^2 = 0.07$ $\delta + \frac{\delta^2 (N-2)}{2} < c$ | |
| Star | Headcount: 8 Region: South Gyeonggi Attendance: 12/20 Sales: 65 $c = 0.36$, $\delta = 0.35$, $\delta^2 = 0.06$ $\delta + \frac{\delta^2 (N-2)}{2} > c$ |
In the case of the first branch, salesmen diligently attend meetings, leading to relatively low costs associated with forming relationships, while the benefits derived from forming relationships are also high. Therefore, a Complete Network structure is efficient because the benefit gained from direct connection with each other outweighs the cost for salesmen.
In the case of the second branch, the salesmen's attendance rate is low, resulting in high costs for establishing mutual relationships. If they were to form relationships, they would need to spend separate time and money on external venues, making the cost relatively high. Consequently, they conduct their sales activities individually, meaning this branch is highly likely to experience turnover once salesmen exhaust their personal network of potential customers.
In the case of the last branch, the cost is not as high as the second case, but direct relationship formation is not efficient. However, since there are indirect benefits to be gained, they do not forgo relationships entirely but instead form a structure where connections are made only with a member who acts as a hub among the salesmen.
4.3. Cohesion Index
Based on these cases, we can intuitively confirm that the relational structure is determined by the organization's 'cohesion'. Therefore, by 'Cohesion Index', we can easily differentiate between organizations with and without relationships. Of the three variables utilized in the preceding Connection Model, the benefit component cannot be arbitrarily changed, allowing us to derive this new variable based on cost and headcount. As shown in the table below, classification can be made based on salesman headcount and meeting attendance frequency. A branch exhibiting high cohesion would likely correspond to either a Complete or Star Network.
To quantitatively calculate cohesion, various methodologies exist. For instance, the attendance (or non-attendance) of salesmen within a group over a month could be modeled using a binomial distribution, which could then be used to represent the probabilistic frequency based on the group's headcount. Subsequently, a cohesion score could be calculated against a specific threshold (calibration). However, instead of deep calculations, we aim to calculate this using a simpler method here. We base our approach on the fundamental idea that a larger group headcount may lead to a lower frequency of meetings. We categorize the groups into histogram-like bins based on headcount, and then determine the cohesion score by assessing if a group's meeting frequency is lower than the average frequency(=Expected Attendance) of its respective bin. This approach is considered reasonable as it somewhat compensates for the difficulty of frequent meetings in groups with a high number of members.
| Headcount | Expected Attendance (= Avg. Frequency) | # of branch |
| 1~ 5 | 14 | 87 |
| 6~7 | 13 | 68 |
| 8~10 | 13 | 87 |
| +11 | 12 | 67 |
By using this method, we can find an example that re-emphasizes that the initial assumption of independence was flawed: the example of a group with a large headcount but a low cohesion score. The headcount of this group is in the top 10% of all groups. However, the salesmen's low attendance results in high costs for forming relationships, and the benefits are also low. Consequently, it can be concluded that they operate their sales activities individually, without forming mutual relationships. For the company, as synergy does not occur in such an organization, considering the next steps—such as reallocating active salesmen to other groups—would be advisable.
| Network Type | Group Information | Graph |
| Empty | Headcount: 13 Region: South Gyeonggi Attendance: 7/20 Sales: 62 $c = 0.46$, $\delta = 0.09$, $\delta^2 = 0.008$ $\delta + \frac{\delta^2 (N-2)}{2} < c$ |
5. Conclusion
This study analyzed the performance of sales branches by focusing on relational effects among members. Unlike stereotype of the business that mainly explained performance through quantitative factors such as headcount or market size, this study incorporated a relational perspective to empirically examine how the structure of relationships among members affect overall performance.
These results demonstrate that the relational structure within an organization plays a critical role in determining its overall performance. In particular, cohesive networks enhance communication and cooperation, which improves the efficiency of information sharing and task execution. In contrast, fragmented networks increase relationship costs and make the organization vulnerable to inefficiency.
From a practical perspective, the results provide implications for managing sales organizations. Managers should not only focus on increasing the number of members but also design and maintain internal relationship structures that promote cooperation and cohesion. Maintaining an optimal team size and fostering internal connectivity may lead to higher organizational performance.
In addition, branches with low cohesion should be managed through interventions that strengthen relationships among members, such as team meetings, mentoring programs, and leadership-centered communication structures. Using the Cohesion Index (CI) proposed in this study, managers can regularly diagnose the relational health of branches and implement improvement measures accordingly.
While this study is significant for proposing an analytical framework that integrates the qualitative aspect of relational effects into performance analysis, it has several limitations that also suggest avenues for future research.
First, a core methodological approach of this study is the use of regression residuals to estimate relational benefits $\delta$ and costs $c$. This approach is predicated on the novel assumption that the performance variance unexplained by quantitative factors contains embedded information about relational dynamics. However, this is a strong assumption and constitutes a key limitation, as the residuals may also capture the effects of other unmeasured variables. Therefore, the estimated values for benefits and costs should be interpreted with caution as indicators of relational effects rather than precise measurements. Future research could focus on methodologically complementing this approach to validate or refine these estimations.
Second, the study is constrained by the inherent limitations of the Symmetric Connection Model itself. The model assumes that two salespeople in a relationship derive the exact same benefit and incur identical costs. This is a simplifying assumption that, while making the analysis tractable, may not fully capture the complexity of real-world interactions. In practice, organizational relationships are often asymmetric, with one party bearing greater costs or deriving different utility. Future studies should therefore explore the application of asymmetric models to investigate how unequal benefit-cost structures alter the formation of organizational networks.
Finally, there is a limitation related to the proxy variable used for relationship formation costs. This study utilized the branch's 'meeting attendance frequency,' which primarily reflects the 'quantity' or 'opportunity' for interaction rather than its 'quality.' High attendance does not necessarily equate to effective communication, and vice versa. This poses a limitation in fully explaining the cost of relationship formation. Consequently, future research would benefit from collecting more direct, qualitative data through methods like surveys to measure aspects such as relationship satisfaction or trust, thereby providing a more nuanced understanding of relational dynamics within the organization.
Appendix A. Illustration of the Symmetric Connection Model
To provide an intuitive understanding of the theoretical framework applied in this study,
this appendix briefly illustrates the Symmetric Connection Model (Jackson & Wolinsky, 1996) using simple network cases. This model assumes that each agent decides whether to form or maintain links with other agents by weighing the benefits of connection against the costs of maintaining those links.
Here, $\delta$ represents the decay parameter that discounts the benefit as the network distance between two agents increases, and $c_{ij}$ denotes the cost incurred by maintaining a direct link between agents $i$ and $j$. The first summation term represents the benefit gained through both direct and indirect connections, while the second term represents the cost associated with direct connections.
General Case 1: Complete Network
A complete network is one where every agent is directly connected to every other agent. For a complete network consisting of n agents, each agent maintains $n-1$ direct links. The distance to any other agent is $1$. The utility for any single agent $i$ is the sum of benefits from $n-1$ connections minus the cost of maintaining those $n-1$ links:
$$u_i = (n-1) \delta - (n-1) c$$
The total utility of the complete network is the sum of utilities for all $n$ agents:
$$U_{complete} (g) = n \times [(n-1) \delta - (n-1)c ] = n(n-1)(\delta-c)$$
Interpretation : This structure maximizes direct information flow and cohesion. However, its total utility is highly sensitive to the cost $c$, as the number of links, $n(n-1)/2$, grows quadratically with the number of agents. This network is efficient only when the net benefit per connection $(\delta-c)$ is sufficiently high
General Case 2: Star Network
A star network consists of one central agent connected to all other $n-1$ peripheral agents, with no links between the peripheral agents themselves.
The utility of the central agent, who maintains $\(n-1\)$ direct links, is:
$$u_{center} = (n-1) \delta 0 (n-1) c$$
The utility of any peripheral agent is different. They have one direct link (to the center, distance 1) and $(n-2)$ indirect links (to other peripherals, distance 2). The utility is:
$$u_{peripheral} = \delta^1 + (n-2) \delta^2 - c$$
The total utility of the star network is the sum of the central agent's utility and the utilities of all $(n-1)$ peripheral agents:
$$U_{star} (g) = u_{center} + (n-1) \times u_{peripheral}$$
Thus,
$$ U_{star} (g)= [(n-1) \delta - (n-1)c ] +(n-1) [\delta + (n-2) \delta^2 -c ]$$
Interpretation: The star network is a more cost-efficient structure than the complete network, especially when connection costs $c$ are moderate. It relies on a central hub to facilitate information flow, which makes the network efficient but also vulnerable to the removal or failure of the central agent.
General Case 3: Empty Network
An empty network is a state where no links exist among the agents.
In this structure, no agent has any connections. Therefore, they receive no benefits and incur no costs from the network. The utility for any single agent $i$ is:
$$u_i=0$$
The total utility of the empty network is consequently zero:
$$U_{empty}(g)=0$$
Interpretation: This structure represents the baseline scenario of no interaction or cooperation. It typically emerges when the cost of forming a single link $c$ is higher than the benefit $\delta$ that can be derived from it, providing no incentive for agents to connect. It signifies a complete lack of organizational cohesion.
References
1. Jackson, M.O. and Wolinsky, A. (1996) ‘A strategic model of social and economic networks’, Journal of Economic Theory, vol 71, No. 1 pp 44–74.