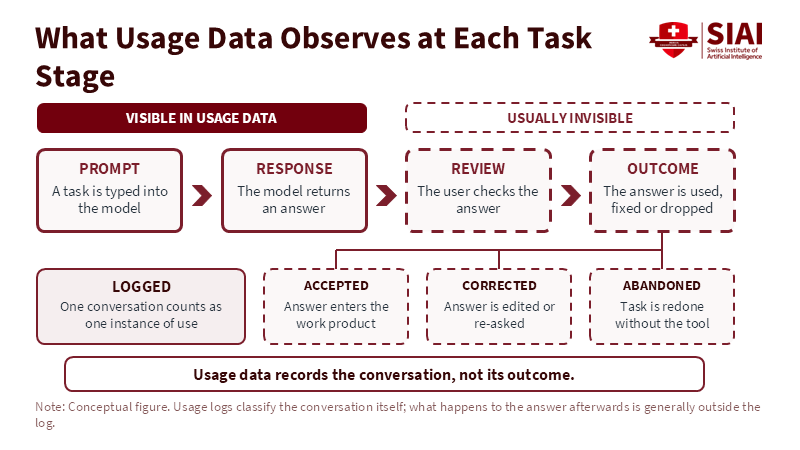
What Usage Data Observes at Each Task Stage Picture Member for 1 year 11 months Real name SIAI Chart Bio SIAI Chart Input Sep 30, 2026 00:47 Modified Sep 30, 2026 00:54 Figure 2: Logs capture the prompt and response, while acceptance, correction and abandonment happen out of view. Related article: Generative AI at Work: Measured Use, Abandoned Effort Picture Member for 1 year 11 months Real name SIAI Chart Bio SIAI Chart Previous What a Task’s Share of Chats Can Reflect Next The staircase from memorized fact to tranferable understanding Similar Post Sep 30, 2026 00:47 What Usage Data Observes at Each Task Stage Sep 30, 2026 00:47 What a Task’s Share of Chats Can Reflect Sep 30, 2026 00:34 Mean and Median Time to Exploit and Share of Zero-Day Vulnerabilities, 2018 to 2026 Sep 30, 2026 00:34 Reinforcing Loop from Technical Debt to a Wider Technical Gap Sep 26, 2026 18:15 Youth AI-Exposure Gap in Payroll and Survey Data, 2022 to 2024 Sep 26, 2026 18:15 Pilot B Sample Size by Detectable Employment Effect, Scenario Sep 26, 2026 18:15 Monitoring Thresholds and Response Steps for Workforce Policy Sep 26, 2026 18:15 South Korean Jobseeker Benefit as a Share of Prior Daily Wage, 2026 Rules Sep 26, 2026 18:15 Maximum Monthly Payouts under Singapore's Jobseeker Support Scheme