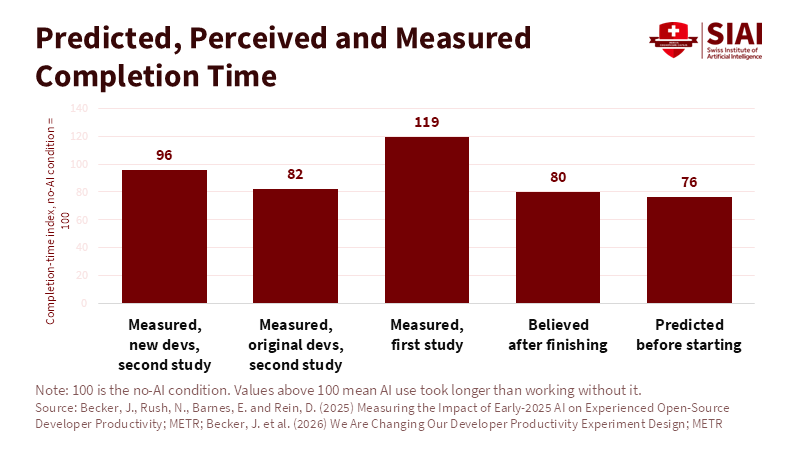
Predicted, Perceived and Measured Completion Time Picture Member for 1 year 11 months Real name SIAI Chart Bio SIAI Chart Input Sep 25, 2026 02:44 Modified Sep 25, 2026 03:02 Figure 6. Developers’ expectations and perceptions diverged sharply from measured productivity effects. Related article: [AI and Workforce] AI Adoption and the Changing Value of Human Work Picture Member for 1 year 11 months Real name SIAI Chart Bio SIAI Chart Previous AI Failure-Rate Halving Time by Task Duration Next Employment Share by GenAI Exposure, Sex and Income Similar Post Sep 25, 2026 02:44 Employment Share by GenAI Exposure, Sex and Income Sep 25, 2026 02:44 Predicted, Perceived and Measured Completion Time Sep 25, 2026 02:44 AI Failure-Rate Halving Time by Task Duration Sep 25, 2026 02:44 AI Success Rate and Task-Duration Sensitivity by Job Family Sep 25, 2026 02:44 Evidence Direction by Research Design Sep 25, 2026 02:44 Net Time Saving by Review Time and Rework Probability Sep 25, 2026 02:44 Exposure and Operational Constraints by Task Type Sep 25, 2026 02:44 Capability, Adoption, Redesign and Outcomes Sep 24, 2026 03:26 Weighted Components of the AI Talent Composite Score in Thirteen Economies